Punjab State Board PSEB 9th Class Social Science Book Solutions Economics Chapter 2 मानव-संसाधन Exercise Questions and Answers.
PSEB Solutions for Class 9 Social Science Economics Chapter 2 मानव-संसाधन
SST Guide for Class 9 PSEB मानव-संसाधन Textbook Questions and Answers
(क) वस्तुनिष्ठ प्रश्न
रिक्त स्थान भरें:
(i) भारत का विश्व में जनसंख्या के आकार के अनुसार …….. स्थान है।
(ii) अशिक्षित लोग समाज में परिसम्पत्ति की अपेक्षा ………….. बन जाते हैं।
(iii) देश की जनसंख्या का आकार, इसकी कार्यकुशलता, शैक्षिक योग्यता उत्पादकता आदि ………………… कहलाते हैं।
(iv) …………. क्षेत्र में प्राकृतिक साधनों का उपयोग करके उत्पादन क्रियाएं की जाती है।
(v) ……… क्रियाएं वस्तुओं व सेवाओं के उत्पादन में सहायक होती हैं।
उत्तर-
- दूसरे
- दायित्व
- मानव संसाधन
- प्राथमिक
- आर्थिक।
बहुविकल्पी प्रश्न :
प्रश्न 1. कृषि अर्थव्यवस्था किस क्षेत्र की उदाहरण है ?
(अ) प्राथमिक
(आ) सेवाएां
(इ) गौण।
उत्तर-
(अ) प्राथमिक
![]()
प्रश्न 2.
कृषि क्षेत्र में 5 से 7 मास लोग बेकार रहते है, इस बेकारी को क्या कहते हैं ?
(अ) छिपी बेरोज़गारी
(आ) मौसमी बेरोज़गारी
(इ) शिक्षित बेरोज़गारी।
उत्तर-
(आ) मौसमी बेरोज़गारी
प्रश्न 3.
भारत में जनसंख्या की कार्यशीलता की आयु की सीमा क्या है ?
(अ) 15 वर्ष से 59 वर्ष तक
(आ) 18 वर्ष से 58 वर्ष तक
(इ) 16 वर्ष से 60 वर्ष तक।
उत्तर-
(अ) 15 वर्ष से 59 वर्ष तक
प्रश्न 4.
2011 की जनगणना के अनुसार भारत की जनसंख्या है ?
(अ) 1210.19 मिलियन
(आ) 130 मिलियन
(इ) 121.19 मिलियन।
उत्तर-
(अ) 1210.19 मिलियन
सही/गलत :
- एक गृहिणी का अपने गृह में कार्य करना एक आर्थिक क्रिया है।
- नगर में अधिक छिपी हुई बेरोज़गारी होती है।
- मानव पूंजी में निवेश करने से देश विकसित होता है।
- अर्थव्यवस्था के विकास के लिए एक देश की जनसंख्या का स्वस्थ होना ज़रूरी है।
- सन् 1951 से 2011 तक भारत की साक्षरता दर में वृद्धि हुई है।
उत्तर-
- गलत
- गलत
- सही
- सही
अति लघु उत्तरों वाले प्रश्न
प्रश्न 1.
दो प्राकृतिक साधनों के नाम बनाएं।
उत्तर-
दो प्राकृतिक साधन निम्न हैं1. वायु 2. खनिज।
प्रश्न 2.
जर्मनी एवं जापान जैसे देशों ने तीव्र गति से आर्थिक विकास कैसे किया ?
उत्तर-
जर्मनी तथा जापान जैसे देशों में मानव पूंजी निर्माण में निवेश करके तीव्र आर्थिक विकास किया है।
प्रश्न 3.
आर्थिक क्रियाएं क्या हैं ?
उत्तर-
आर्थिक क्रियाएं वे क्रियाएं हैं जो धन कमाने के उद्देश्य से की जाती हैं।
प्रश्न 4.
गुरुप्रीत तथा मनदीप द्वारा की गई दो आर्थिक क्रियाएं कौन-सी हैं ?
उत्तर-
गुरुप्रीत खेत में काम करता है तथा मनदीप को एक निजी बस्ती में रोजगार मिल गया है।
प्रश्न 5.
गौण-क्षेत्र की कोई दो उदाहरण दें।
उत्तर-
गौण-क्षेत्र के दो उदाहरण निम्नलिखित हैं-
- चीनी का गन्ने से निर्माण।
- कपास से कपड़े का निर्माण ।
प्रश्न 6.
गैर आर्थिक (अनार्थिक) क्रियाएं कौन-सी हैं ?
उत्तर-
गैर आर्थिक क्रियाएं वे क्रियाएं हैं जो धन कमाने के उद्देश्य से नहीं की जाती हैं।
![]()
प्रश्न 7.
जनसंख्या की गुणवत्ता के दो निर्धारकों के नाम बताएं।
उत्तर-
- अच्छी शिक्षा
- लोगों का अच्छा स्वास्थ्य।
प्रश्न 8.
सर्वाधिक साक्षर राज्य का नाम क्या है ?
उत्तर-
केरल।
प्रश्न 9.
6 से 14 वर्ष तक के आयु वर्ग के सभी बच्चों को एलीमैंटरी शिक्षा प्रदान करने के लिए उठाए गए कदम का नाम बताएं।
उत्तर-
सर्व शिक्षा अभियान।
प्रश्न 10.
भारत में जनसंख्या की कार्यशीलता आयु की सीमा क्या है ?
उत्तर-
15-59 वर्ष।
प्रश्न 11.
भारत सरकार द्वारा रोज़गार अवसर प्रदान करने के लिए उठाए गए दो कार्यक्रमों का नाम बताएं।
उत्तर-
- स्वर्ण जयंती ग्राम स्वरोजगार योजना।
संपूर्ण ग्रामीण रोजगार योजना।
(स्व) लघु उत्तरों वाले प्रश्न
प्रश्न 1.
मानव संसाधन से आपका क्या अभिप्राय है ?
उत्तर-
किसी देश की जनसंख्या का वह भाग जो कुशलता, शिक्षा उत्पादकता तथा स्वास्थ्य से संपन्न होता है उसे मानव संसाधन कहते हैं। मानव संसाधन एक महत्त्वपूर्ण संसाधन है क्योंकि यह प्राकृतिक संसाधनों को अधिक उपयोगी बना देता है। एक देश जिसमें शिक्षित तथा प्रशिक्षित व्यक्ति अधिक संख्या में हों उनकी उत्पादकता अधिक होती है।
प्रश्न 2.
मानव संसाधन किस प्रकार भूमि व भौतिक पूंजी जैसे अन्य साधनों से श्रेष्ठ है ?
उत्तर-
मानव संसाधन अन्य साधनों जैसे भूमि व भौतिक पूंजी से इसलिए उत्तम है क्योंकि यह अन्य साधन स्वयं नियोजित नहीं हो सकते। मानव संसाधन ही इन साधनों का प्रयोग करता है। इस तरह बड़ी जनसंख्या एक दायित्व नहीं है। इन्हें मानवीय पूंजी में निवेश करके संपत्ति में बदला जा सकता है। उदाहरण के लिए शिक्षा व स्वास्थ्य पर किया गया व्यय लोगों को प्रशिक्षित व शिक्षित तथा स्वस्थ बनाता है जिससे आधुनिक तकनीक का प्रयोग करके देश का विकास किया जा सकता है।
प्रश्न 3.
आर्थिक व अनार्थिक क्रियाओं में क्या अन्तर है।
उत्तर-
इनमें भेद निम्न हैं-
| आर्थिक क्रियाएं | अनार्थिक क्रियाएं |
| 1. आर्थिक क्रियाएं अर्थव्यवस्था में वस्तुओं व सेवाओं का प्रवाह करती हैं। | 1. अनार्थिक क्रियाओं से वस्तुओं व सेवाओं का कोई प्रवाह अर्थव्यवस्था में नहीं होता। |
| 2. जब आर्थिक क्रियाओं में वृद्धि होती है तो इसका अर्थ है अर्थव्यवस्था प्रगति में है। | 2. अनार्थिक क्रियाओं में होने वाली कोई भी वृद्धि अर्थव्यवस्था की प्रगति की निर्धारक नहीं है। |
| 3. आर्थिक क्रियाओं से वास्तविक व राष्ट्रीय आय में वृद्धि होती है। | 3. अनार्थिक क्रियाओं में से कोई राष्ट्रीय आय व वास्तविक आय में वृद्धि नहीं होती। |
प्रश्न 4.
मानव पूंजी निर्माण में शिक्षा की क्या भूमिका है ?
उत्तर-
शिक्षा मानव पूंजी निर्माण में महत्त्वपूर्ण भूमिका निभाती है-
- शिक्षा आर्थिक तथा सामाजिक विकास का मुख्य साधन है।
- शिक्षा विज्ञान और तकनीक के विकास में सहायता करती है।
- शिक्षा श्रमिकों की कार्यकुशलता को बढ़ाती है।
- शिक्षा लोगों की मानसिक क्षमताओं को बढ़ाने में सहायता करता है।
- शिक्षा राष्ट्रीय आय को बढ़ाती है। प्राकृतिक गुणवत्ता को बढ़ाती है और प्राथमिक कुशलता में वृद्धि करती है।
प्रश्न 5.
भारत सरकार द्वारा शिक्षा के प्रसार के लिए कौन-से कदम उठाए गए हैं।
उत्तर-
भारत सरकार ने निम्न कदम उठाए हैं :
- शिक्षा संस्थानों का निर्माण किया जा रहा है।
- प्राथमिक विद्यालयों को लगभग 5,00,000 गांवों में खोला गया है।
- ‘सर्व शिक्षा अभियान’ सभी को अनिवार्य शिक्षा प्रदान करवाने की सिफ़ारिश करती है जो 6-14 वर्ष के सभी बच्चों को अनिवार्य शिक्षा देती है।
- बच्चों के पौष्टिक स्तर को बढ़ाने के लिए ‘मिड-डे-मील’ योजना शुरू की गई है।
- सभी जिलों में नवोदय विद्यालय खोले गए हैं।
![]()
प्रश्न 6.
बेरोज़गारी शब्द की व्याख्या करें। देश की बेरोज़गारी दर को निर्धारित करते समय किस वर्ग के लोगों को सम्मिलित नहीं किया जाता ?
उत्तर-
बेरोज़गारी वह स्थिति है जिसमें वह व्यक्ति जो प्रचलित मज़दूरी की दर पर काम करने को तैयार होता है पर उसे काम नहीं मिलता है। किसी देश में कार्यशील जनसंख्या वह जनसंख्या होती है जो 15-59 वर्ष की आयु के बीच होती है। 15 से कम आयु के बच्चों और 59 से अधिक आयु के वृद्ध यदि काम ढूंढ़ते भी हैं तो उन्हें बेरोज़गार नहीं कहा जाता।
प्रश्न 7.
भारत में बेरोजगारी के दो कारण बताएं।
उत्तर-
कारण (Causes)-
- जनसंख्या में वृद्धि (Increase in Population)-भारत में बेरोज़गारी का मुख्य कारण जनसंख्या में होने वाली वृद्धि है। जनसंख्या बढ़ने से देश को संपत्ति का एक बड़ा भाग इस जनसंख्या की आवश्यकताओं को पूरा करने में खर्च हो जाता है और रोज़गार के अवसरों को बढ़ाने के लिए कम साधन बचते हैं।
- दोषपूर्ण शिक्षा प्रणाली (Defected Education System) सरकार ने लोगों के जीवन स्तर को उठाने के लिए कई कॉलेजों और स्कूलों की स्थापना की है जिसमें आज करोड़ों छात्र शिक्षा ग्रहण कर रहे हैं। परंतु उनको रोज़गार नहीं मिलता जिसका मुख्य कारण दोषपूर्ण शिक्षा प्रणाली का होना है।
प्रश्न 8.
छिपी बेरोज़गारी व मौसमी बेरोज़गारी में अंतर स्पष्ट करें।
उत्तर-
| छिपी बेरोजगारी | मौसमी बेरोजगारी |
| 1. नगरीय क्षेत्र बेरोज़गारी का वह प्रश्न है जिसमें श्रमिक कार्य करते हुए प्रतीत होते हैं पर ये वास्तव में होते नहीं हैं। | 1. यह बेरोज़गारी का वह प्रकार है जिसमें श्रमिक कुछ विशेष मौसम में ही कार्य प्राप्त करते हैं। |
| 2. यह प्रायः कषि क्षेत्र में पायी जाती है। | 2. वह प्रायः कृषि संबंधी उद्योगों में पायी जाती है। |
| 3. यह प्रायः ग्रामीण क्षेत्रों में पायी जाती है। | 3. वह ग्रामीण व शहरी दोनों क्षेत्रों में पायी जाती है। |
प्रश्न 9.
नगरीय क्षेत्र में शिक्षित बेकारी में तीव्र गति से क्यों वृद्धि हो रही है ?
उत्तर-
शिक्षित बेरोज़गारी शहरी बेरोज़गारी का उदाहरण हैं। यह शहरी क्षेत्रों में ग्रामीण क्षेत्रों की तुलना में अधिक पाई जाती है। शहरों में तीव्र गति से खुलने वाले स्कूल व शैक्षिक संस्थानों से शिक्षित बेरोज़गारी को बढ़ाया है क्योंकि रोज़गार का स्तर इतना नहीं बढ़ा है जितनी विद्यालयों की संख्या बढ़ी है।
प्रश्न 10.
बेरोज़गार लोग समाज के लिए परिसम्पत्ति की अपेक्षा बोझ (देनदारी) क्यों बन जाते हैं। स्पष्ट करो।
उत्तर-
बेरोजगार व्यक्ति एक देश के लिए संपत्ति के स्थान पर दायित्व होता है क्योंकि इससे मानव शक्ति संसाधनों का दुरुपयोग होता है। बेरोज़गारी गरीबी को बढ़ाता है। इससे निराशा की स्थिति उत्पन्न होती है। बेरोज़गार लोग कार्यशील जनसंख्या पर निर्भर रहते हैं।
प्रश्न 11.
अशिक्षित व कमज़ोर स्वास्थ्य वाले लोग अर्थव्यवस्था को कैसे प्रभावित करते हैं ?
उत्तर-
जनसंख्या की गुणवत्ता किसी देश की संवृद्धि का निर्धारण करती है। शिक्षित जनसंख्या देश के लिए संपत्ति होती है तथा अस्वस्थ लोग अर्थव्यवस्था के लिए दायित्व होता है। किसी देश की संवृद्धि के लिए शिक्षित जनसंख्या एक महत्त्वपूर्ण आगत है। यह आधुनिकीकरण तथा सामर्थ्य को बढ़ाता है। शिक्षित व्यक्ति न केवल अपनी व्यक्तिगत संवृद्धि को मानव-संसाधन बढ़ाता है बल्कि समुदाय की भी संवृद्धि बढ़ाता है। जबकि दूसरी ओर अस्वस्थता वह स्थिति है जिसमें लोग शारीरिक व बौद्धिक रूप से ठीक नहीं होते हैं।
![]()
अन्य अभ्यास के प्रश्न
क्रिया-1
अपने गांव अथवा अपनी कॉलोनी में जाकर मालूम करें कि:
(i) भिन्न-भिन्न घरों की औरतें गृहकार्य करती हैं अथवा बाहर कार्य करने जाती है ?
(ii) उनका कार्य आर्थिक क्रिया में आता है अथवा गैर आर्थिक क्रिया में ?
(iii) आर्थिक व गैर-आर्थिक क्रियाओं के दो-दो उदाहरण दें।
(iv) आपके घर में आपकी माता जी द्वारा किया गया कार्य आर्थिक अथवा गैर-आर्थिक क्रिया में किस के अंतर्गत आता
उत्तर-
- मेरे गांव में अधिकतर महिलाएं अपने घरों में ही कार्य करती हैं। कुछ महिलाएं बाहर काम करने भी जाती हैं। जो दफ्तरों में दूसरे घरों में साफ़-सफाई के लिए भी जाती हैं।
- जो महिलाएं अपने घरों में घरेलू कार्य कर रही हैं जैसे खाना बनाना, साफ सफाई करना, बच्चों की देखभाल करना, पशुओं को चारा डालना आदि सभी क्रियाएं गैर आर्थिक क्रियाएं ही हैं। दूसरी ओर जो महिलाएं दफ्तरों में कार्य कर रही हैं तथा दूसरों के घरों में काम कर रही हैं वे क्रियाएं आर्थिक क्रियाएं हैं।
- आर्थिक क्रिया के उदाहरण-
- राज द्वारा एक बहु-राष्ट्रीय कंपनी में कार्य करना
- डॉक्टर द्वारा अस्पताल में रोगियों की देखभाल करना।
गैर-आर्थिक क्रिया के उदाहरण-- गृहिणी द्वारा किया गया घरेलू कार्य
- एक अध्यापक द्वारा अपने बच्चे को घर में पढ़ाना।
- मेरी माता जी एक अध्यापिका हैं। उनका कार्य आर्थिक क्रिया में आता है।
क्रिया-2
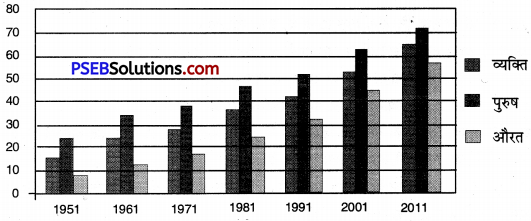
जनगणना वर्ष के आंकड़े
ग्राफ 2.1 भारत में साक्षरता दर
ग्राफ 2.1 का अध्ययन कीजिए तथा निम्नलिखित प्रश्नों के उत्तर दीजिए :
(i) क्या वर्ष 1951 से 2011 तक व्यक्तियों की साक्षरता दर में वृद्धि हुई है ?
(ii) भारत ने किस वर्ष 50% की साक्षरता दर को पार किया ?
(iii) किस वर्ष भारत की साक्षरता दर सर्वाधिक रही ?
(iv) महिलाओं की साक्षरता दर किस वर्ष अधिकतम है ?
(v) अपने अध्यापक से चर्चा कीजिए। भारत में पुरुषों की अपेक्षा महिलाओं की साक्षरता दर कम क्यों है ?
उत्तर-
- हाँ वर्ष 1951 से 2011 तक साक्षरता-दर लगातार बढ़ी है जो कि ग्राफ 2.1 से स्पष्ट है।
- वर्ष 2001 में भारत में साक्षरता दर 50% से पार हुई थी।
- वर्ष 2011 में भारत की साक्षरता-दर सबसे अधिक है।
- वर्ष 2011 में महिलाओं की साक्षरता-दर सबसे अधिक है।
- भारत में पुरुषों की अपेक्षा महिलाओं की साक्षरता-दर इसलिए कम है क्योंकि लोग लड़कों की अपेक्षा लड़कियों को स्कूल कम भेजते हैं। लड़कियों को ये घरेलू कार्यों में लगा देते हैं।
क्रिया-3
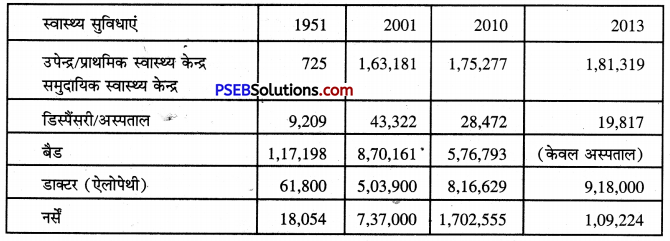
तालिका 2.2. भारत में स्वास्थ्य सेवाओं का विस्तार स्वास्थ्य सुविधाएं
आइए चर्चा करें:
सारणी 2.2 को पढ़िए तथा निम्नलिखित प्रश्नों के उत्तर दीजिए।
(i) वर्ष 1951 से 2010 तक डिसपैंसरी व अस्पतालों की संख्या में कितनी वृद्धि है।
(ii) वर्ष 2001 से 2013 तक चिकित्सकों की संख्या में कितनी वृद्धि हुई।
(iii) वर्ष 1981 से 2013 तक स्वास्थ्य संस्थाओं में बैडों की संख्या कितनी वृद्धि हुई।
(iv) अपने गांव अथवा निकटवर्ती गांव की डिसपैंसरी में जाकर मालूम कीजिए तथा ज्ञात कीजिए कि इनमें कौन-सी सुविधाएं दी जा रही हैं तथा किन की आवश्यकता अधिक है ?
उत्तर-
- तालिका 2.2 से स्पष्ट है कि वर्ष 1951 से 2010 तक औषधालयों व अस्पतालों की संख्या बढ़ी नहीं है। अर्थात् कुछ वर्षों में बढ़ी है तथा कुछ में कम हुई है।
- हाँ, वर्ष 2001 से 2016 तक डॉक्टरों की संख्या बढ़ी है।
- हाँ, वर्ष 1981-2016 तक बिस्तरों की संख्या बढ़ी है।
- नज़दीक के औषधालय का दौरा करने से ज्ञात हुआ कि वहाँ स्टॉफ की कमी थी। यहाँ तक कि वहाँ डॉक्टर भी उपलब्ध नहीं था। केवल एक थर्मासिस्ट व चतुर्थ श्रेणी कर्मचारी थे। अन्य सुविधाएं ठीक थीं।
PSEB 9th Class Social Science Guide मानव-संसाधन Important Questions and Answers
रिक्त स्थान भरें :
- जनसंख्या के आकार में चीन विश्व में ……… स्थान पर है।
- अस्वस्थ लोग समाज के लिए ………. होते हैं न कि एक परिसंपत्ति।
- जापान ने …………… संसाधनों में निवेश किया है।
- गृहणी द्वारा किया गया घरेलू कार्य एक …………… क्रिया है।
- वर्ष 2011 में भारत में …………. राज्य की साक्षरता दर सबसे कम थी।
- 2011 जनगणना के अनुसार भारत की साक्षरता दर ………… प्रतिशत है।
उत्तर-
- पहला
- दायित्व
- मानव
- गैर-आर्थिक
- बिहार
- 74.
बहुविकल्पीय प्रश्न :
प्रश्न 1.
जनसंख्या अर्थव्यवस्था पर हो सकती है ? …
(क) दायित्व
(ख) परिसंपत्ति
(ग) उपरोक्त दोनों
(घ) इनमें से कोई नहीं।
उत्तर-
(ग) उपरोक्त दोनों
![]()
प्रश्न 2.
मानव पूंजी निर्माण किस में निवेश से होता है ?
(क) शिक्षा
(ख) चिकित्सा
(ग) प्रशिक्षण
(घ) उपरोक्त सभी।
उत्तर-
(घ) उपरोक्त सभी।
प्रश्न 3.
भारत में मानव पूंजी निर्माण को दर्शाता है-
(क) हरित क्रांति
(ख) सूचना प्रौद्योगिकी क्रांति
(ग) उपरोक्त दोनों
(घ) मज़दूर क्रांति।
उत्तर-
(ख) सूचना प्रौद्योगिकी क्रांति
प्रश्न 4.
शीला द्वारा अपने घर में खाना बनाना, कपड़े धोना, बर्तन साफ करना आदि कौन-सी क्रिया है ?
(क) आर्थिक
(ख) ग़ैर-आर्थिक
(ग) धन क्रिया
(घ) इनमें से कोई नहीं।
उत्तर-
(ख) ग़ैर-आर्थिक
प्रश्न 5.
कृषि, वानिकी व पशुपालन कौन-से क्षेत्रक के अंतर्गत आते हैं ?
(क) प्राथमिक
(ख) द्वितीयक
(ग) तृतीयक
(घ) उपरोक्त सभी।
उत्तर-
(क) प्राथमिक
प्रश्न 6.
उत्खनन और विनिर्माण किस क्षेत्रक में आते हैं ?
(क) द्वितीयक
(ख) तृतीयक
(ग) प्राथमिक
(घ) इनमें से कोई नहीं।
उत्तर-
(क) द्वितीयक
प्रश्न 7.
व्यापार, परिवहन, संचार व बैंकिंग सेवाएं आदि कौन-से क्षेत्रक में आती हैं ?
(क) प्राथमिक
(ख) द्वितीयक
(ग) तृतीयक
(घ) इनमें से कोई नहीं।
उत्तर-
(ग) तृतीयक
प्रश्न 8.
भारत में जीवन प्रत्याशा कितने वर्ष है ?
(क) 66
(ख) 70
(ग) 55
(घ) 75.8.
उत्तर-
(घ) 75.8.
प्रश्न 9.
भारत में अशोधित जन्म-दर प्रति हज़ार व्यक्तियों के पीछे कितनी है ?
(क) 26.1
(ख) 28.2
(ग) 20.4
(घ) 35.1.
उत्तर-
(क) 26.1
प्रश्न 10.
भारत में मृत्यु-दर प्रति हज़ार व्यक्तियों के पीछे कितनी है ?
(क) 9.8
(ख) 8.7
(ग) 11.9
(घ) 25.1.
उत्तर-
(ख) 8.7
प्रश्न 11.
2001 में भारत में साक्षरता-दर कितने प्रतिशत थी ?
(क) 65
(ख) 75
(ग) 60
घ) 63.
उत्तर-
(क) 65
![]()
प्रश्न 12.
2001 में ग्रामीण क्षेत्र में कौन-सी बेरोज़गारी पायी जाती है ?
(क) मौसमी
(ख) प्रच्छन्न बेरोज़गारी।
(ग) उपरोक्त दोनों
(घ) ऐच्छिक बेरोज़गारी।
उत्तर-
(ग) उपरोक्त दोनों
प्रश्न 13.
नगरीय क्षेत्रों में कौन-सी बेरोज़गारी अधिकांशतः पायी जाती है ?
(क) मौसमी
(ख) ऐच्छिक
(ग) प्रच्छन्न
(घ) शिक्षित।
उत्तर-
(घ) शिक्षित।
प्रश्न 14.
श्रमिकों का गांव से शहरों की ओर काम की तलाश में जाना क्या कहलाता है ?
(क) प्रवास
(ख) आवास
(ग) खोज
(घ) इनमें से कोई नहीं।
उत्तर-
(क) प्रवास
प्रश्न 15.
देश की उत्पादन क्षमता में वृद्धि किसके निवेश से होती है ?
(क) भूमि में
(ख) भौतिक पूंजी में
(ग) मानव पूंजी में
(घ) उपरोक्त सभी में।
उत्तर-
(घ) उपरोक्त सभी में।
प्रश्न 16.
इनमें से कौन प्राथमिक क्षेत्र का उदाहरण है ?
(क) कृषि
(ख) विनिमय
(ग) संचार
(घ) व्यापार।
उत्तर-
(क) कृषि
प्रश्न 17.
इनमें से कौन द्वितीयक क्षेत्र का उदाहरण है ?
(क) कृषि
(ख) विनिर्माण
(ग) संचार
(घ) बैंकिंग।
उत्तर-
(ख) विनिर्माण
प्रश्न 18.
इनमें से कौन तृतीयक क्षेत्र का उदाहरण है ?
(क) कृषि
(ख) विनिर्माण
(ग) बैंकिंग
(घ) इनमें से कोई नहीं।
उत्तर-
(ग) बैंकिंग
प्रश्न 19.
आर्थिक क्रियाएं कितने प्रकार की होती हैं ?
(क) एक
(ख) दो
(ग) तीन
(घ) चार।
उत्तर-
(ख) दो
प्रश्न 20.
किस वर्ष भारत में साक्षरता-दर सबसे अधिक थी ?
(क) 2001
(ख) 1991
(ग) 2000
(घ) 1981.
उत्तर-
(क) 2001
![]()
प्रश्न 21.
किस प्रकार के लोग समाज के लिए दायित्व होते हैं ?
(क) शिक्षित
(ख) स्वस्थ
(ग) अस्वस्थ
(घ) इनमें से कोई नहीं।
उत्तर-
(ग) अस्वस्थ
प्रश्न 22.
भारत में सर्व शिक्षा अभियान कब लागू किया गया ?
(क) 2008
(ख) 2010
(ग) 2007
(घ) 2005.
उत्तर-
(ख) 2010
प्रश्न 23.
इनमें से किस देश ने मानव संसाधन पर अधिक मात्रा में निवेश किया है?
(क) पाकिस्तान
(ख) चीन
(ग) भारत
(घ) जापान।
उत्तर-
(घ) जापान।
प्रश्न 24.
इनमें से कौन एक बाज़ार क्रिया है?
(क) एक शिक्षक द्वारा स्कूल में पढ़ाना।
(ख) एक शिक्षक द्वारा अपने बच्चे को पढ़ाना।
(ग) एक कृषक द्वारा स्वयं उपभोग के लिए सब्जियां उगना।
(घ) एक माता द्वारा बच्चों की देखभाल करना।
उत्तर-
(क) एक शिक्षक द्वारा स्कूल में पढ़ाना।
सही/गलत :
- शिक्षित व स्वस्थ जनसंख्या दायित्व होती है।
- 2011 जनगणना के अनुसार पुरुषों की साक्षरता दर 82.10 प्रतिशत है।
- ‘ भारत में वर्ष 1983 से 2011 तक औसत बेरोज़गारी दर 9 प्रतिशत रही है।
- गुणवत्ता वाली जनसंख्या अच्छी शिक्षा तथा स्वास्थ्य पर निर्भर नहीं करती है।
- खनन तथा वानिकी द्वितीय क्षेत्र की क्रियाएं हैं।
उत्तर-
- गलत
- सही
- सही
- गलत
- गलत।
अति लघु उत्तरों वाले प्रश्न
प्रश्न 1.
जनसंख्या मानव पूंजी में कब बदलती है ?
उत्तर-
जब शिक्षा, प्रशिक्षण और चिकित्सा सेवाओं में निवेश किया जाता है तो जनसंख्या मानव पूंजी में बदल जाती है।
प्रश्न 2.
मानव पूंजी निर्माण से क्या अभिप्राय है ?
उत्तर-
जब मानव संसाधन को और अधिक शिक्षा तथा स्वास्थ्य द्वारा विकसित किया जाता है तो उसे मानव पूंजी निर्माण कहते हैं।
प्रश्न 3.
मानव पूंजी निर्माण के भारत को दो लाभ बताएं।
उत्तर-
मानव पूंजी निर्माण से भारत में हरित क्रांति आई है जिससे खाद्यान्नों की उत्पादकता में कई गुणा वृद्धि हुई है। मानव पूंजी निर्माण से ही भारत में सूचना प्रौद्योगिकी में क्रांति एक आश्चर्यजनक उदाहरण है।
प्रश्न 4.
जापान कैसे विकसित देश बना ?
उत्तर-
जापान ने मानव संसाधन पर निवेश किया है। उनके पास कोई प्राकृतिक संसाधन नहीं थे। वे अब अपने देश के लिए आवश्यक प्राकृतिक संसाधनों का आयात कर लेते हैं।
प्रश्न 5.
क्या 1951 से जनसंख्या की साक्षरता-दर बढ़ी है ?
उत्तर-
हां, साक्षरता-दर 1951 के 18 प्रतिशत से बढ़कर 2001 में 65 प्रतिशत हो गई है।
![]()
प्रश्न 6.
कोई देश विकसित कैसे बन सकता है ?
उत्तर-
कोई भी देश लोगों में विशेष रूप से शिक्षा और स्वास्थ्य के क्षेत्र में निवेश से विकसित बन सकता है।
प्रश्न 7.
भारत में जीवन प्रत्याशा कितनी है ?
उत्तर-
यह वर्ष 2017 में 75.8 वर्ष थी।
प्रश्न 8.
बेरोज़गारी क्या होती है ?
उत्तर-
बेरोज़गारी उस समय विद्यमान कही जाती है, जब प्रचलित मज़दूरी की दर पर काम करने के लिए इच्छुक लोग रोज़गार नहीं पा सकते।
प्रश्न 9.
जन्म-दर से क्या अभिप्राय है ?
उत्तर-
जन्म-दर से अभिप्राय प्रति हज़ार व्यक्तियों के पीछे जितने बच्चे जन्म लेते हैं, उससे है।
प्रश्न 10.
मृत्यु-दर से क्या अभिप्राय है ?
उत्तर–
प्रति हज़ार व्यक्तियों के पीछे जितने लोगों की मृत्यु होती है वही मृत्यु-दर कहलाती है।
प्रश्न 11.
बेरोज़गारी क्या है ?
उत्तर-
एक स्थिति जिसमें श्रमिक बाज़ार में प्रचलित मज़दूरी पर काम करने को तैयार हैं पर उन्हें काम नहीं मिलता है।
प्रश्न 12.
राष्ट्रीय आय क्या होती है ?
उत्तर-
यह एक देश द्वारा उत्पादित वस्तुओं व सेवाओं का कुल योग होता है।
प्रश्न 13.
सर्व शिक्षा अभियान क्या है ?
उत्तर-
यह एक ऐसा कार्यक्रम है जिसमें 6-14 वर्ष के सभी आयु वर्ग के बच्चों को प्रारंभिक शिक्षा प्रदान की जाती है।
प्रश्न 14.
कार्य बल संख्या में किस वर्ग की जनसंख्या को शामिल किया गया है ?
उत्तर-
कार्य बल जनसंख्या में 15 से 59 वर्ष के व्यक्तियों को शामिल किया जाता है।
प्रश्न 15.
किसी कार्य को करने के लिए पांच व्यक्ति चाहिए पर उसमें 8 व्यक्ति लगे हैं। इसे कौन-सी बेरोज़गारी कहा जाएगा?
उत्तर-
प्रच्छन्न बेरोज़गारी।
प्रश्न 16.
मौसमी बेरोज़गारी क्या है ?
उत्तर-
इस तरह की बेरोज़गारी में व्यक्ति वर्ष के कुछ विशेष महीनों में कार्य प्राप्त कर पाते हैं।
प्रश्न 17.
इनमें से कौन-से तत्त्व मानव के विकास के गुणों को बढ़ाते हैं ?
उत्तर-
शिक्षा तकनीकी एवं स्वास्थ्य।
प्रश्न 18.
तृतीयक कार्य क्षेत्र से संबंधित दो कार्य क्षेत्र बताएं।
उत्तर-
- परिवहन
- बैंकिंग।
लघु उत्तरों वाले प्रश्न
प्रश्न 1.
जनसंख्या की गुणवत्ता की व्याख्या करें।
उत्तर-
जनसंख्या की गुणवत्ता साक्षरता-दर, जीवन-प्रत्याशा से निरूपित व्यक्तियों के स्वास्थ्य और देश के लोगों द्वाराप्राप्त कौशल निर्माण पर निर्भर करती है। यह अंततः देश की संवृद्धि-दर निर्धारित करती है। अस्वस्थ व निरक्षर जनसंख्या अर्थव्यवस्था पर बोझ होती है तथा स्वस्थ व साक्षर जनसंख्या परिसंपत्तियां होती हैं।
प्रश्न 2.
शिक्षा के महत्त्व की व्याख्या करें।
उत्तर-
शिक्षा का महत्त्व निम्नलिखित है-
- शिक्षा अच्छी नौकरी और अच्छे वेतन के रूप में फल देती है।
- यह विकास के लिए महत्त्वपूर्ण आगत है।
- इससे जीवन के मूल्य विकसित होते हैं।
- यह राष्ट्रीय आय और सांस्कृतिक समृद्धि में वृद्धि करती है।
- यह प्रशासन की कार्य-क्षमता बढ़ाती है।
![]()
प्रश्न 3.
बेरोज़गारी के प्रभावों का वर्णन करें।
उत्तर-
बेरोज़गारी के निम्नलिखित प्रभाव पड़ते हैं
- बेरोज़गारी से जनशक्ति संसाधन की बर्बादी होती है। जो लोग अर्थव्यवस्था के लिए परिसंपत्ति होते हैं, बेरोज़गारी के कारण बोझ में बदल जाते हैं।
- इससे युवकों में निराशा और हताशा की भावना बढ़ती है।
- बेरोज़गारी से आर्थिक बोझ में वृद्धि होती है। कार्यरत जनसंख्या पर बेरोज़गारी की निर्भरता बढ़ती है।
- इससे समाज के जीवन की गुणवत्ता पर बुरा प्रभाव पड़ता है।
- किसी अर्थव्यवस्था के समग्र विकास पर बेरोज़गारी का अधिकतर प्रभाव पड़ता है। इसमें वृद्धि मंदीग्रस्त अर्थव्यवस्था का सूचक है।
प्रश्न 4.
छिपी बेरोज़गारी से क्या अभिप्राय है ?
उत्तर-
छिपी बेरोज़गारी या प्रच्छन्न बेरोज़गारी के अंतर्गत लोग नियोजित प्रतीत होते हैं, उनके पास भूमि होती है, जहां उन्हें काम मिलता है। ऐसा प्रायः कृषिगत काम में लगे परिजनों में होता है। किसी काम में पांच लोगों की आवश्यकता है लेकिन उसमें आठ लोग होते हैं। इनमें तीन अतिरिक्त हैं। अगर तीन लोगों को हटा दिया जाए तो खेत की उत्पादकता में कोई कमी नहीं आएगी। खेत में पांच लोगों के काम की आवश्यकता है और तीन अतिरिक्त लोग प्रच्छन्न रूप से नियोजित हैं।
प्रश्न 5.
मौसमी बेरोज़गारी से क्या अभिप्राय है ?
उत्तर-
मौसमी बेरोज़गारी तब होती है, जब लोग वर्ष के कुछ महीनों में रोजगार प्राप्त नहीं कर पाते हैं। कृषि पर आश्रित लोग आमतौर पर इस तरह की समस्या से जूझते हैं। वर्ष में कुछ व्यस्त मौसम होते हैं जब बुआई, कटाई और गहाई होती है। कुछ विशेष महीनों में कृषि पर आश्रित लोगों को अधिक काम नहीं मिल पाता।
प्रश्न 6.
शिक्षित बेरोज़गारी से क्या अभिप्राय है ?
उत्तर-
शहरी क्षेत्रों के मामले में शिक्षित बेरोज़गारी एक सामान्य परिघटना बन गई है। मैट्रिक स्नातक और स्नातकोत्तर डिग्री धारी अनेक युवक रोजगार पाने में असमर्थ हैं। एक अध्ययन में यह बात सामने आई है कि मैट्रिक की तुलना में स्नातक युवकों में बेरोज़गारी अधिक तेजी से बढ़ी है। एक विरोधाभासी जनशक्ति स्थिति सामने आई है कि कुछ विशेष श्रेणियों में जनशक्ति के आधिक्य के साथ ही कुछ अन्य श्रेणियों में जनशक्ति की कमी विद्यमान है।
प्रश्न 7.
बाज़ार व गैर-बाज़ार क्रियाओं का अर्थ स्पष्ट करें।
उत्तर-
बाज़ार क्रियाओं में वेतन या लाभ के उद्देश्य से की गई क्रियाओं के लिए पारिश्रमिक भुगतान किया जाता है। इनमें सरकारी सेवा सहित वस्तु सेवाओं का उत्पादन शामिल है। गैर-बाज़ार क्रियाओं से अभिप्राय स्व- उपभोग के लिए उत्पादन है। इनमें प्राथमिक उत्पादों का उपभोग और प्रसंस्करण तथा अचल संपत्तियों का स्वलेखा उत्पादन आता है।
प्रश्न 8.
जनसंख्या एक मानवीय साधन है, व्याख्या करें।
उत्तर-
यह विशाल जनसंख्या का एक सकारात्मक पहलू है जिसे प्रायः उस वक्त अनदेखा कर दिया जाता है जब हम इसके नकारात्मक पहलू को देखते हैं अर्थात् भोजन, शिक्षा और स्वास्थ्य सुविधाओं तक जनसंख्या की पहुंच की समस्याओं पर विचार करते समय। जब इस विद्यमान मानव संसाधन को और अधिक शिक्षा तथा स्वास्थ्य द्वारा विकसित किया जाता है, तब हम इसे मानव पूँजी निर्माण कहते हैं।
प्रश्न 9.
द्वितीयक व तृतीयक क्षेत्रों में कौन-सी क्रियाएँ की जानी हैं ?
उत्तर-
द्वितीयक क्षेत्रों में उत्खनन और विनिर्माण शामिल है, जबकि तृतीयक क्षेत्र में परिवहन, बैंकिंग, संचार, बीमा, व्यापार, शिक्षा आदि किए जाते हैं।
प्रश्न 10.
आर्थिक क्रियाएं क्या होती हैं ? व्याख्या करें।
उत्तर-
आर्थिक क्रियाएं वह क्रियाएं होती हैं जिनके फलस्वरूप वस्तुओं और सेवाओं का उत्पादन होता है। ये क्रियाएं राष्ट्रीय आय में मूल्य वर्धन करते हैं। आर्थिक क्रियाएं दो प्रकार की होती हैं।-
1. बाज़ार क्रियाएं
2. गैर-बाज़ार क्रियाएं।।
- बाज़ार क्रियाएं-बाज़ार क्रियाओं में वेतन या लाभ के उद्देश्य से की गई क्रियाओं के लिए पारिश्रमिक का भुगतान किया जाता है।
- गैर-बाज़ार क्रियाएं-इसमें स्व-उपभोग के लिए उत्पादन क्रियाओं को शामिल किया जाता है। इनमें प्राथमिक उत्पादों का उपभोग और प्रसंस्करण तथा अचल संपत्तियों का स्वलेखा उत्पादन आता है।
प्रश्न 11.
बाज़ार क्रियाओं व गैर-बाज़ार क्रियाओं में भेद करें।
उत्तर-
बाज़ार क्रियाओं व गैर-बाज़ार क्रियाओं में निम्नलिखित अंतर हैं-
| बाज़ार क्रियाएं | गैर-बाज़ार क्रियाएं |
| 1. बाज़ार क्रियाओं में वेतन या लाभ के उद्देश्य से की गई सेवाओं के लिए पारिश्रमिक का भुगतान किया जाता है। | 1. गैर-बाज़ार क्रियाओं में स्व: उपभोग के लिए उत्पादन किया जाता है। |
| 2. इसमें वस्तुओं व सेवाओं का उत्पादन सरकारी सेवाओं के साथ किया जाता है। | 2. इसमें प्राथमिक उत्पादों का उपभोग और प्रसंस्करण एवं अचल संपत्तियों का स्वलेखा उत्पादन आता है। |
| 3. इसके मुख्य उदाहरण, शिक्षक द्वारा स्कूल में पढ़ाना, खनन का कार्य इत्यादि हैं। | 3. प्राथमिक उत्पादों का उपभोग व अचल संपत्तियों का स्वलेखा आदि इसके उदाहरण हैं। |
प्रश्न 12.
1. ग्रामीण क्षेत्रों में पायी जाने वाली दो प्रकार की बेरोज़गारियां कौन-सी हैं ?
2. उन चार कारणों को बताएं जिन पर संख्या की गुणवत्ता निर्भर करती है।
3. कौन-सा क्षेत्रक (प्राथमिक क्षेत्रक में ) अर्थव्यवस्था में सबसे अधिक जनशक्ति को नियोजित करता है?
उत्तर-
1.
- प्रच्छन्न बेरोज़गारी तथा
- मौसमी बेरोज़गारी या ग्रामीण क्षेत्रों में पाए जाने वाली दो मुख्य बेरोज़गारियां हैं।
2.
- स्वास्थ्य
- जीवन प्रत्याशा
- शिक्षा
- कार्यकुशलता।
3.कृषि क्षेत्र एक ऐसा क्षेत्र है जो अर्थव्यवस्था में अधिकतर जनशक्ति को नियोजित करता है।
![]()
प्रश्न 13.
1. वे दो मुख्य क्रियाएं बताएं जो प्राथमिक क्षेत्र में की जाती हैं।
2. वे दो मुख्य क्रियाएं बताएं जो तृतीय क्षेत्र में की जाती हैं।
3. वे दो मुख्य क्रियाएं बताएं जो द्वितीय क्षेत्र में की जाती हैं।
उत्तर-
1.
- मत्सय पालन
- खनन
2.
- बैंकिंग
- बीमा
3.
- उल्ख नन
- विनिर्माण।
प्रश्न 14.
1. ऐसे चार तत्व बताएं जो मानव संसाधन की गुणवत्ता को बढ़ाते हैं ?
2. उत्पादन के चार संसाधनों के नाम बताएं।
उत्तर-
1.
- शिक्षा
- स्वास्थ्य
- तकनीकी
- प्रशिक्षण।
2.
- भूमि
- पूंजी
- श्रम
- उद्यमी।
प्रश्न 15.
सर्व शिक्षा अभियान क्या है?
उत्तर-
सर्व शिक्षा अभियान 6-14 वर्ष आयु वर्ग के सभी स्कूली बच्चों को वर्ष 2010 तक प्राथमिक शिक्षा प्रदान करने की दिशा में एक महत्त्वपूर्ण कदम है। राज्यों, स्थानीय सरकारों और प्राथमिक शिक्षा सार्वभौमिक लक्ष्य को प्राप्त करने के लिए समुदाय की सहभागिता के साथ केंद्रीय सरकार की एक समयबद्ध पहल है।
प्रश्न 16.
1. कृषि क्षेत्र में कौन-सी बेरोज़गारियां पाई जाती हैं ?
2. प्रच्छन्न बेरोज़गारी का अर्थ बताएं।
उत्तर-
- प्रच्छन्न व मौसमी बेरोज़गारी कृषि क्षेत्र में पाई जाती है।
- प्रच्छन्न बेरोज़गारी से अभिप्राय उस बेरोज़गारी से है जिसमें लोग कार्य करते हुए प्रतीत होते हैं पर वे होते नहीं हैं।
प्रश्न 17.
मानव पूंजी में किया जाने वाला निवेश बाद में बदलकर भौतिक पूंजी में किए गए निवेश का रूप धारण कर लेता है। व्याख्या करें।
उत्तर-
- मानव पूंजी श्रमिकों की उत्पादकता को बढ़ाता है।
- मानव पूंजी श्रमिकों की गुणवत्ता में वृद्धि करता है।
- स्वस्थ, शिक्षित व प्रशिक्षित व्यक्ति उत्पादन के साधनों का कुशल प्रयोग कर सकते हैं।
- एक देश मानव संसाधनों का निर्यात करके विदेशी विनिमय प्राप्त कर सकता है।
प्रश्न 18.
इन सभी कार्यों को प्राथमिक, द्वितीयक व तृतीयक समूहों में बांटे।
बैंकिंग, बीमा, डेयरी, उत्खनन, खनन, संचार, शिक्षा, मत्स्य पालन, मुर्गी पालन, कृषि, विनिर्माण, वानिकी, पर्यटन तथा व्यापार।
उत्तर-
| प्राथमिक क्षेत्र | द्वितीयक क्षेत्र | तृतीयक क्षेत्र |
| 1. डेयरी | 1. उत्खनन | 1. बैंकिंग |
| 2. खनन | 2. विनिर्माण | 2. बीमा |
| 3. मत्स्य पालन | 3. संचार | |
| 4. मुर्गी पालन | 4. शिक्षा | |
| 5. कृषि | 5. पर्यटन | |
| 6. वानिकी | 6. व्यापार। |
प्रश्न 19.
शिक्षा के क्षेत्र में दसवीं पंचवर्षीय योजना के मुख्य उद्देश्य क्या हैं ?
उत्तर-
शिक्षा के क्षेत्र में दसवीं पंचवर्षीय योजना के मुख्य उद्देश्य निम्नलिखित हैं-
- दसवीं योजना अंत तक उच्च शिक्षा में 18-23 वर्ष आयु वर्ग के नामांकन में वर्तमान 6 प्रतिशत से 9 प्रतिशत तक की वृद्ध करने का प्रयास किया गया है।
- यह रणनीति पहुंच में वृद्धि, गुणवत्ता, राज्यों के लिए विशेष पाठ्यक्रम में परिवर्तन को स्वीकार करना, व्यवसायीकरण तथा सूचना प्रौद्योगिकों के उपयोग का जाल बिछाने पर केंद्रित है।
- दसवीं योजना दूरस्थ शिक्षा, संचार प्रौद्योगिकी की शिक्षा देने वाले शिक्षण संस्थानों के अभिसरण पर भी केंद्रित है।
प्रश्न 20.
बेरोज़गारी क्या है? भारत में बेरोज़गारी के मुख्य प्रकार क्या हैं ?
उत्तर-
बेरोज़गारी वह स्थिति है जिसमें श्रमिक मज़दूरी की वर्तमान दर पर काम करने को तैयार होते हैं पर उन्हें काम नहीं मिलता है।
बेरोज़गारी के प्रकार-
- मौसमी बेरोजगारी
- शिक्षित बेरोज़गारी
- प्रच्छन्न बेरोज़गारी
- संरचनात्मक बेरोज़गारी
- तकनीकी बेरोज़गारी।
प्रश्न 21.
ग्रामीण क्षेत्रों में पाई जाने वाली दो प्रकार की मुख्य बेरोज़गारी क्या है ? इसके लिए मुख्य चार कारण बताएं।
उत्तर-
मौसमी बेरोज़गारी व प्रच्छन्न बेरोज़गारी ग्रामीण क्षेत्रों में पायी जाने वाली मुख्य बेरोज़गारियां हैं। कारण-
- कृषि क्षेत्र में विविधता की कमी।
- पूंजी की कमी।
- अति जनसंख्या के कारण बड़े परिवार।
- लघु व कुटीर उद्योग का अल्पविकास।
![]()
प्रश्न 22.
प्रच्छन्न बेरोज़गारी व शिक्षित बेरोज़गारी में अंतर करें।
उत्तर-
प्रच्छन्न बेरोज़गारी व शिक्षित बेरोज़गारी में निम्नलिखित अंतर हैं :
| प्रच्छन्न बेरोजगारी | शिक्षित बेरोजगारी |
| 1. प्रच्छन्न बेरोज़गारी वह बेरोज़गारी है जिसमें व्यक्ति कार्य करते हुए प्रतीत होते हैं पर वह होते नहीं हैं। | 1. शिक्षित बेरोज़गारी वह स्थिति है जिसमें व्यक्ति शिक्षित होते हैं पर उनके पास रोज़गार नहीं होता है। |
| 2. यह प्रायः ग्रामीण क्षेत्रों में पायी जाती है। | 2. यह प्रायः शहरी क्षेत्रों में पायी जाती है। |
प्रश्न 23.
तीनों क्षेत्रकों में रोज़गार की स्थिति का वर्णन करें।
उत्तर-
- प्राथमिक क्षेत्रक-भारत में, प्राथमिक क्षेत्रक में अर्थव्यवस्था की अधिकतर जनसंख्या नियोजित है। परंतु इसमें प्रच्छन्न बेरोज़गारी विद्यमान है। इसमें अब और अधिक व्यक्ति नियोजित करने की क्षमता नहीं है। इसलिए बाकी श्रमिक द्वितीयक व ततीयक क्षेत्रों की ओर जा रहे हैं।
- द्वितीयक क्षेत्रक-द्वितीयक क्षेत्रक में लघु स्तरीय विनिर्माण भी अधिक व्यक्तियों को रोज़गार प्रदान करता है। ग्रामीण क्षेत्रों में और अधिक व्यक्तियों को नियोजित करने के लिए गांवों में कुटीर उद्योगों की स्थापना की जानी चाहिए।
- तृतीयक क्षेत्रक-तृतीयक क्षेत्र भारत में से बेरोज़गारी को दूर करने के लिए एक महत्त्वपूर्ण क्षेत्रक है।
प्रश्न 24.
मौसमी बेरोज़गारी क्या होती है? इस बेरोज़गारी के लिए उत्तरदायी मुख्य कारण क्या है ?
उत्तर-
मौसमी बेरोज़गारी तब होती है जब लोग वर्ष के कुछ महीनों में रोजगार प्राप्त नहीं कर पाते हैं। कृषि पर आश्रित लोग आमतौर पर इस तरह की समस्या से जूझते हैं।
कारण-
- कृषि की विविधता में कमी।।
- ग्रामीण क्षेत्रों में लघु एवं कुटीर उद्योगों की कमी।
- कृषि के व्यापारीकरण का अभाव।
प्रश्न 25.
प्रच्छन्न बेरोज़गारी क्या है? उदाहरण सहित व्याख्या करें।
उत्तर-
प्रच्छन्न बेरोज़गारी के अंतर्गत लोग नियोजित प्रतीत होते है। उनके पास भूखंड होता है, जहाँ उन्हें काम मिलता है। ऐसा प्रायः कृषिगत काम में लगे परिजनों में होता है। किसी काम में पांच लोगों की आवश्यकता होती है लेकिन उसमें आठ लोग लगे होते हैं। इसमें तीन लोग अतिरिक्त हैं। ये तीनों इसी खेत पर काम करते हैं जिस पर पांच लोग काम करते हैं। इन तीनों द्वारा किया गया अंशदान पांच लोगों द्वारा किए गए योगदान में कोई बढ़ोत्तरी नहीं करता। यदि तीन लोगों को हटा दिया जाए तो उत्पादकता में कोई कमी नहीं आयेगी। खेत में पांच लोगों के काम की आवश्यकता होती है और तीन अतिरिक्त लोग प्रच्छन्न रूप से नियोजित होते हैं।
प्रश्न 26.
मानवीय पूंजी उत्पादन का सबसे महत्त्वपूर्ण साधन क्यों हैं ? तीन कारण दें।
उत्तर-
मानवीय पूंजी उत्पादन का सबसे महत्त्वपूर्ण साधन निम्नलिखित कारणों से हैं-
- कुछ उत्पादन क्रियाओं में ज़रूरी कार्यों को करने के लिए बहुत ज्यादा पढ़े-लिखे कर्मियों की ज़रूरत होती है।
- बहुत-सी क्रियाओं में शारीरिक कार्य करने वाले श्रमिकों की ज़रूरत होती है।
- केवल मानवीय पूंजी में ही उद्यमवृत्ति का गुण पाया जाता है।
प्रश्न 27.
जापान जैसे देश कैसे धनी व विकसित बने ? तीन कारणों से व्याख्या करें।
उत्तर-
जापान जैसे देश के धनी व विकसित बनने के तीन कारणों की व्याख्या निम्नलिखित है-
- उन्होंने लोगों में विशेष रूप से शिक्षा और स्वास्थ्य के क्षेत्र में निवेश किया है।
- उन लोगों ने भूमि और पूंजी जैसे अन्य संसाधनों का कुशल उपयोग किया है।
- इन लोगों ने जो कुशलता और प्रौद्योगिकी विकसित की, उसी से ये देश धनी व विकसित बने हैं।
प्रश्न 28.
भारत में स्वास्थ्य स्तर की स्थिति की व्याख्या करें।
उत्तर-
किसी व्यक्ति का स्वास्थ्य उसे अपनी क्षमता को प्राप्त करने और बीमारियों से लड़ने की ताकत देता है। अस्वस्थ लोग किसी संगठन के लिए बोझ बन जाते हैं। वास्तव में, स्वास्थ्य अपना कल्याण करने का एक अपरिहार्य आधार है। इसलिए जनसंख्या की स्वास्थ्य स्थिति को सुधारना किसी देश की प्राथमिकता होती है। हमारी राष्ट्रीय नीति का लक्ष्य भी जनसंख्या के अल्प सुविधा प्राप्त वर्गों पर विशेष ध्यान देते हुए स्वास्थ्य सेवाओं, परिवार कल्याण और पोष्टिक सेवा तक इनकी पहुंच को बेहतर बनाना है। पिछले पांच दशकों में भारत ने सरकारी और निजी क्षेत्रों में प्राथमिक, द्वितीयक तथा तृतीयक सेवाओं के लिए आपेक्षित एक विस्तृत स्वास्थ्य आधारित संरचना और जनशक्ति का निर्माण किया है।
प्रश्न 29.
बेरोज़गारी क्या है ? इसके मुख्य प्रभाव क्या होते हैं ?
उत्तर-
बेरोज़गारी उस समय विद्यमान कही जाती है, जब प्रचलित मज़दूरी की दर पर काम करने के लिए इच्छुक लोग रोज़गार नहीं पा सके। प्रभाव-बेरोज़गारी से जनशक्ति संसाधन की बर्बादी होती है। जो लोग अर्थव्यवस्था के लिए परिसंपत्ति होते हैं, बेरोज़गारी के कारण दायित्व में बदल जाते हैं, युवकों में निराशा और हताशा की भावना होती है। लोगों के पास अपने परिवार का भरण-पोषण करने के लिए पर्याप्त मुद्रा नहीं होती। शिक्षित लोगों के साथ जो कार्य करने के इच्छुक हैं और सार्थक रोजगार प्राप्त करने में असमर्थ हैं, यह एक बड़ा सामाजिक अपव्यय है। बेरोज़गारी से आर्थिक बोझ में वृद्धि होती है। कार्यरत जनसंख्या पर बेरोज़गारी की निर्भरता बढ़ती है। किसी व्यक्ति और साथ-ही साथ समाज के जीवन की गुणवत्ता पर बुरा प्रभाव पड़ता है।
प्रश्न 30.
मानव पूंजी निर्माण क्या है ? मानव पूंजी संसाधन अन्य संसाधनों से भिन्न कैसे हैं ?
उत्तर-
मानव पूंजी निर्माण से अभिप्राय ऐसे व्यक्ति उपलब्ध करवाना और उनकी संख्या में वृद्धि करना है जो शिक्षित, कुशल तथा अनुभव संपन्न हों, जो एक देश के आर्थिक विकास के लिए बहुत आवश्यक है। व्यक्तियों को अच्छी शिक्षा, स्वास्थ्य संबंधी सुविधाएं, उनकी जीवन प्रत्याशा में वृद्धि, शिशु मृत्यु-दर में कमी करके और उनको तकनीकी ज्ञान देकर उन्हें मानव पूंजी बनाया जा सकता है। मानव पूंजी संसाधन भूमि व भौतिक पूंजी जैसे अन्य संसाधनों से भिन्न है क्योंकि मानव संसाधन भूमि और भौतिक पूंजी जैसे अन्य संसाधनों का प्रयोग कर सकता है। अन्य साधन अपने आप उपयोगी नहीं हो सकते।
![]()
प्रश्न 31.
1. सकल राष्ट्रीय उत्पादक क्या होता है?
2. जापान के पास कोई प्राकृतिक संसाधन नहीं है, फिर भी वे विकसित देश कैसे हैं ? कारण बताएं।
उत्तर-
- सकल राष्ट्रीय उत्पादन एक देश के निवासियों के द्वारा एक वर्ष की अवधि में उत्पादित सभी अंतिम वस्तुओं व सेवाओं के उत्पादक का मूल्य है।
- जापान देश ने मानव संसाधन पर भारी निवेश किया है।
- उन्होंने लोगों में विशेष रूप से उनकी शिक्षा व स्वास्थ्य पर निवेश किया।
- शिक्षित व स्वस्थ व्यक्ति भूमि व पूंजी जैसे साधनों का अधिक कुशल उपयोग कर सकते हैं।
प्रश्न 32.
किसी देश के लिए उसकी जनसंख्या के स्वास्थ्य के स्तर में सुधार करना मुख्य पहल होती है। कारण बताएं।
उत्तर-
- अच्छा स्वास्थ्य श्रमिकों की निपुणता को बढ़ाता है।
- एक अस्वस्थ श्रमिक देश के लिए दायित्व होता है।
- स्वस्थ नागरिक उत्पादन का मूलभूत संसाधन होता है।
- किसी व्यक्ति का स्वास्थ्य उसे अपनी क्षमता को प्राप्त करने और बीमारियों से लड़ने की ताकत देता है।
प्रश्न 33.
किस प्रकार अर्थव्यवस्था के समग्र विकास पर बेरोज़गारी का अहितकर प्रभाव पड़ता है? चार बिंदुओं पर इसकी व्याख्या कीजिए।
उत्तर-
- बेरोज़गारी से जनशक्ति संसाधन की बर्बादी होती है जो लोग अर्थव्यवस्था के लिए परिसंपत्ति होते हैं। बेरोज़गारी के कारण दायित्व में बदल जाते हैं।
- युवकों में इससे निराशा और हताशा की भावना होती है क्योंकि इनके पास अपने परिवार का भरण-पोषण करने के लिए पर्याप्त मुद्रा नहीं होती।
- बेरोज़गारी से आर्थिक बोझ में वृद्धि होती है।
- कार्यरत जनसंख्या पर बेरोज़गारी की निर्भरता बढ़ती जाती है जिससे समाज के जीवन की गुणवत्ता पर बुरा प्रभाव पड़ता है।
प्रश्न 34.
भारतीय अर्थव्यवस्था में द्वितीयक क्षेत्र के महत्त्व के बिंदु बताइए।
उत्तर-
इसके महत्त्व के निम्न बिंदु हैं-
- इस क्षेत्रक में विनिर्माण के द्वारा प्राकृतिक संसाधनों को अन्य वस्तुओं में बदला जाता है।
- सभी औद्योगिक क्रियाएं इस क्षेत्र में होती हैं।
- इस क्षेत्र की क्रियाएं प्राथमिक व तृतीयक क्षेत्रक के विकास में सहायता करती है।
- इस क्षेत्र के उत्पादन से अर्थव्यवस्था में प्रतियोगिता संभव होती है।
प्रश्न 35.
औपचारिक व अनौपचारिक क्षेत्र में तुलना करें।
उत्तर-
इनमें अंतर निम्न बिंदुओं द्वारा दर्शाया जा सकता है-
| औपचारिक क्षेत्र | अनौपचारिक क्षेत्र |
| 1. इस क्षेत्र में 10 या 10 से अधिक व्यक्ति नियोजित होते हैं। | 1. इसमें 10 से कम व्यक्ति या कई बार एक भी व्यक्ति नियोजित नहीं होता है। |
| 2. इसमें श्रम बल का बहुत कम प्रतिशत लगभग 7 प्रतिशत नियोजित होता है। | 2. इसमें श्रम बल का बहुत अधिक भाग लगभग 93 प्रतिशत नियोजित होता है। |
| 3. इसमें श्रमिक सामाजिक सुरक्षा लाभ प्राप्त करते हैं। | 3. इसमें श्रमिकों को सामाजिक सुरक्षा के लाभ प्राप्त नहीं होते हैं। |
| 4. इसमें संवृद्धि के बढ़ने से रोज़गार भी बढ़ता है। | 4. इसमें संवृद्धि के बढ़ने से रोज़गार कम होता है। |
दीर्घ उत्तरों वाले प्रश्न
प्रश्न 1.
भारत में मानव पूंजी निर्माण में क्या समस्याएँ हैं ? समझाइए।
उत्तर-
भारत में मानव पूंजी निर्माण में निम्न समस्याएँ हैं
- निर्धनता (Poverty)-भारत के अधिकतर लोग निर्धन हैं जो प्राथमिक स्तर की शिक्षा और स्वास्थ्य संबंधी सुविधाएं जुटाने में भी असफल हैं। अतः निर्धनता मानव पूंजी निर्माण की एक मुख्य समस्या है।
- अनपढ़ता (Illeteracy)-भारत के अधिकतर लोग निरक्षर हैं जिससे वह शिक्षा और स्वास्थ्य संबंधी सुविधाओं के लाभ को नहीं समझ पाते हैं और मानव पूंजी निर्माण में सहयोग नहीं देते हैं।
- सीमित क्षेत्रों में ज्ञान (Knowledge in Limited Area)—मानव पूंजी का ज्ञान कुछ क्षेत्रों तक ही सीमित है। अभी बहुत-से क्षेत्र ऐसे हैं जहाँ इसका अर्थ भी पता नहीं है।
- स्वास्थ्य संबंधी सुविधाओं का अभाव (Lack of Medical Facilities)-भारत में स्वास्थ्य संबंधी सुविधाएं कुछ ही क्षेत्रों तक सीमित हैं। सभी क्षेत्रों में अच्छी स्वास्थ्य सुविधाएं उपलब्ध न होने के कारण सभी लोग शारीरिक तथा मानसिक रूप से स्वस्थ नहीं हैं।
- शिक्षा संबंधी सुविधाओं का अभाव (Lack of Educational Facilities)-भारत में शिक्षा संबंधी सुविधाएं भी कुछ क्षेत्रों तक ही सीमित हैं। अभी तक कुछ क्षेत्रों में तो प्राथमिक स्तर की भी शिक्षा उपलब्ध नहीं है। अत: यह भी मानवीय पूंजी निर्माण की एक मुख्य समस्या है।
- जनसंख्या में वृद्धि (Increase in population)-देश में जनसंख्या में हो रही तीव्र वृद्धि से मानव पूंजी निर्माण में हमेशा बाधा आती रही है।
प्रश्न 2.
मानवीय पूंजी की आर्थिक विकास में भूमिका बताइए।
उत्तर-
मानवीय पूंजी निम्न तरह से आर्थिक विकास में सहायक होती है-
- श्रम की कार्यकुशलता (Efficiency of Labour)—मानवीय पूंजी श्रमिकों की कार्यकुशलता को बढ़ाने में सहायक होती है और कुशल श्रमिकों को रोजगार प्रदान करके उत्पादकता को बढ़ाया जा सकता है जो आर्थिक विकास के लिए अति आवश्यक है।
- प्रशिक्षण तथा तकनीकी ज्ञान (Training and Technical Knowledge)-मानवीय श्रम बनने के लिए लोगों में प्रशिक्षण तथा तकनीकी ज्ञान का होना बहुत आवश्यक है। प्रशिक्षित श्रमिक ही अपने कार्य को अधिक तीव्रता, अधिक मात्रा और अधिक कुशलता से कर सकते हैं जो आर्थिक विकास के लिए आवश्यक है।
- व्यवसाय का बढ़ता हुआ आकार (Large Size of Business)-व्यवसाय के बढ़ते हुए आकार के कारण अधिकतर यंत्रीकरण किया गया है जो केवल प्रशिक्षित श्रमिकों द्वारा संचालित किए जा सकते हैं और उत्पादन में सहायक होते हैं।
- उत्पादन लागत में कमी (Decrease in Production Cost) यदि उत्पादन प्रशिक्षित श्रमिकों द्वारा किया जाता है तो उत्पादन अधिक होता है और उत्पादन लागत कम आती है जिससे उद्यमियों के लाभ बढ़ते हैं और उन्हें व्यवसाय में और अधिक निवेश की प्रेरणा मिलती है।
- औद्योगीकरण का आधार (Bases of Industrialisation)-अल्पविकसित देशों में औद्योगीकरण का आधार रखने के लिए मानव पूंजी निर्माण में निवेश करना आवश्यक है। क्योंकि अधिकतर मानवीय पूंजी होने से औद्योगीकरण का विस्तार होगा।
![]()
मानव-संसाधन PSEB 9th Class Economics Notes
- संसाधन – अपनी क्षमता को बढ़ाने के लिए व्यक्ति, संगठन या राष्ट्र | द्वारा किए गए प्रयास संसाधन हैं।
- प्राकृतिक संसाधन – वायु, खनिज, भूमि, जल आदि का प्रयोग मनुष्य की आवश्यकताओं की पूर्ति के लिए किया जाता है इन्हें ही प्राकृतिक संसाधन कहते हैं।
- मानवीय संसाधन – किसी राष्ट्र की जनसंख्या का वह भाग जो कार्यकुशलता, शिक्षा प्रशिक्षण व स्वास्थ्य से संपन्न है।
- जापान व जर्मनी के आर्थिक विकास के कारण – इनका मानव पूंजी निर्माण में निवेश खासकर स्वास्थ्य व शिक्षा में।
- भारत, बांग्लादेश व पाकिस्तान में अल्पविकास के कारण – उनकी अशिक्षित, अस्वस्थ व अकार्यकुशल बड़ी जनसंख्या।
- आर्थिक क्रियाएं – वे सभी कार्य जो धन कमाने के उद्देश्य से किए जाते हैं।
- गैर आर्थिक क्रियाएं – वे सभी कार्य जो धन कमाने के उद्देश्य से नहीं किए जाते हैं।
- प्राथमिक क्षेत्र – प्राथमिक क्षेत्र वह क्षेत्र है जो प्राकृतिक संसाधनों के प्रयोग द्वारा वस्तुएं निर्मित करता है।
- प्राथमिक क्षेत्र की किस्मों के उदाहरण – कृषि, पशु-पालन, डेयरी, मुर्गीपालन, मत्सय पालन, खनन, वानिकी आदि।
- द्वितीयक क्षेत्र – द्वितीयक क्षेत्र वे क्षेत्र हैं जो प्राथमिक क्षेत्र के उत्पाद का कच्चे माल के रूप में प्रयोग करके अंतिम उत्पाद तैयार करता है।
- तृतीयक क्षेत्र – वह क्षेत्र जो सेवाओं का निर्माण करता है।
- जनसंख्या, संपत्ति या दायित्व के रूप में – अशिक्षित व अस्वस्थ जनसंख्या किसी देश के लिए दायित्व है जबकि शिक्षित व स्वस्थ जनसंख्या किसी देश के लिए संपत्ति है।
- बेरोजगारी – जब कोई व्यक्ति मज़दूरी की प्रचलित दर पर काम करने को | तैयार हो पर उसे काम न मिले।
- मौसमी बेरोजगारी – इसका अर्थ है जब लोग पूरे वर्ष में कुछ महीने काम न करें व रोजगार के लिए भटकते रहें।
- अदृश्य बेरोज़गारी। – यह बेरोज़गारी का वह रूप है जिसमें श्रमिक कार्य करते हुए प्रतीत होते हैं पर वे वास्तव में होते नहीं हैं।
 im1
im1