Punjab State Board PSEB 9th Class Social Science Book Solutions Geography Chapter 5 Natural Vegetation and Wild Life Textbook Exercise Questions and Answers.
PSEB Solutions for Class 9 Social Science Geography Chapter 6 Population
SST Guide for Class 9 PSEB Population Textbook Questions and Answers
Map Work :
Question 1.
Show in the outline map of India :
(i) State and Union territory with highest population.
(ii) State and Union territory with lowest population.
(iii) State and UTs with population density more than 1000 per square km.
(iv) State and UTs with population density less than 100 per square km.
Answer:
Do it yourself with the help of India Map.
Question 2.
(i) Prepare a chart of occupational structure of Punjab with the help of your teacher and put on the wall of your classroom.
Answer:Do it yourself with the help of your teacher.
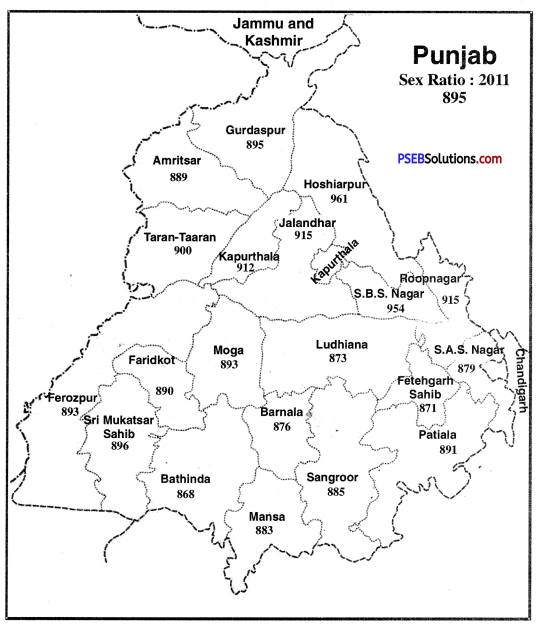
(ii) Prepare a chart of sex ratio of Punjab (district wise) and discuss with your subject teacher.
Answer:
Do it yourself with the help of your teacher.
Objective Type Questions :
Question 1.
Which state has highest population as per census 2011 among the followings :
(a) Uttar Pradesh
(b) Bihar
(c) Bengal
(d) Kerala.
Answer:
(6) Bihar.
Question 2.
Shifting the place of the residence is known as :
(a) Dwelling
(b) Independence
(c) Urbanisation
(d) Migration.
Answer:
(d) Migration.
Question 3.
What percentage of Population was agricultural workers in Punjab as per census 2011?
(a) 35.5
(b) 40.5
(c) 30.5
(d) 27.5
Answer:
(a) 35.5.
![]()
Question 4.
What is meant by female foeticide?
Answer:
Killing of female foetus in the womb of mother is called female foeticide. It reduces sex ratio in the country.
Question 5.
Which factors are necessary to find out the nations socio-economic development?
Answer:
Literally, health, income etc. are the necessary elements to know about the social and economic developoment of the country.
Question 6.
How percentage of increase in population is calculated?
Answer:
It can be calculated by a formula :
\(\frac{\text { No. of Literate persons }}{\text { Total population }}\) × 100
Question 7.
When do we celebrate the World Population Day?
Answer:
World Population Day is celebrated on 11 July.
Short Answer Questions :
Question 1.
Write a note on the position of India in terms of population in the world?
Answer:
According to Census survey of 2011, India’s population was 1,21,05,69,5.73 means more than 121 crore. If we look at the expected data of 2016, it has reached upto 132 crores. Presently, the total population of the world is 742 crore. India’s geographical area is 32 Lakh 87 thousand sq. km. and India is at seventh place in the world. But India’s place is second from population’s aspect and around 17.2% people of the world live in India. It means every sixth person in the world is Indian.
Question 2.
The citizen of Punjab shall be on what rank, in terms of density of population, literacy rate and sex ratio.
Answer:
- Punjab is at 15th place from populations aspect and its population is 2,77,43,338.
- The Density of population in Punjab was 551 persons per sq. km. in 2011 which was 484 persons in 2001.
- Sex ratio in India was 1000 : 895 in 2011 which is actually quite less. Child sex ratio in Punjab was 1000 : 846 in 2011.
- Punjab’s literacy rate is 75.8% and it holds 15th place in India.
Question 3.
What are the main reasons of migration?
Answer:
- Migration in search of employment.
- Migration to find land for agriculture.
- Migration for religious freedom.
- Migration in the hope of more income.
- Migration due to some pressure or any other reason.
- People migrate for political freedom.
- Migration to do marriage.
- Rural people migrate to urban areas in search of better facilities.
![]()
Question 4.
How do we calculate literacy rate? How Punjab is behind many states in India in terms of literacy rate?
Answer:
According to Census of India, one who can* read and write in any Indian language is a literate person. In 1991, it was decided that children below the age of 7 years will be considered illiterate. This decision was followed even in 2Q01 and 2011 Census. There is a formula to know about literacy rate and this is :
Literacy Rate = \(\frac{\text { No. of Literate persons }}{\text { Total population }}\) × 100
If we look at Punjab’s position in terms of literacy rate then Punjab is at 14th place as its literacy rate is 75.8%. It is quite less in comparison to many other states such as Kerala (94%), Mizoram (91.3%), Goa (88.7%), Tripura (87.2%) etc.
Question 5.
Write a note on the distribution of rural-urban population in Punjab?
Answer:
Total population of Punjab is 2,77,43,338 out of which 1,03, 99,146 persons live in urban areas and 1,73,44,192 persons live in villages. In this way 37.5% people live in towns and 62.5% people live in villages. Urban population in 2001 was 33.9% which increased to 37.5% in 2011. Actually due to many factors, urban population is increasing such as more facilities, more opportunities of education and employment. During this period, there came great urbanisation in Sahibzada Ajit Singh Nagar district in which 54.8% people live in cities. In Taran Taran, only 12.7% live in urban areas and 87.3% people live in villages. So, we can say that gradually urban population is increasing.
Question 6.
Describe the National Population Policy 2000.
Answer:
While keeping in mind many objectives, Indian Government in 2000, made National Population Policy whose major aims are given below :
- Compulsory and free education upto the age of 14 years.
- To reduce the number of students who leave their education at primary and secondary level.
- To reduce infant mortality rate upto 30 per 1000.
- To reduce maternal mortality rate less than 100 per 1,00,000.
- To give preference to small family.
- To encourage girls to not to marry before the age of 18.
- To give stress on delievering children from trained individuals.
- To achieve the target of stable population till 2045.
Long Answer Questions :
Answer the following questions in detail :
Question 1.
What are the -specific problems adolescents may face?
Answer:
When a child crosses the age of 10 years, he enters the adolescent age. This age remains till 19 years. In this age, many physical and mental changes come in a child because of which he/she faces many problems which are given below :
- Child Marriage. This custom still prevails in many parts of the country and children with less than prescribed age group gets married. It reduces their physical and mental development. They are even unable to get proper education.
- Child Labour. A large portion of Indian population still lives below poverty line. That’s why children are forced to do any work to maintain their ‘house. They come under pressure in very early age to earn money when there is a time to take education.
- Drug Addiction. In this age, children very quickly adopt a wrong path and many children become drug addicts. Their future gets spoiled.
- Inadequate Diet. This is the age when children need good and healthy diet for proper physical and mental development. But due to poverty or any other reason, they are unable to get nutritious diet. It creates an obstacle in their allround development.
- Problem of Dropouts from Schools. This is the age when children take education and make their future. But it has been seen many parents withdraw their children from schools even before secondary level. They are forced to earn money which becomes a major problem for them.
![]()
Question 2.
Discuss situation of India and Punjab from migration point of view.
Answer:
Population of an area never remains the same. Birth rate and death rate plays an important role in increasing or decreasing population. But migration also plays an important role in this. But question arises that what is Migration? Actually the meaning of migration is when people leave one place to another place to live over there. This mobility or movement can be temporary as well as permanent
1. India’s Position. There is no denying the fact that many Indians migrate to foreign countries. North Indians prefer to migrate to the countries such as U.S.A., Canada, England, Australia, Germany etc. South Indians prefer to migrate to Gulf Countries. Actually everyone wants to earn more money and that’s why they migrate to western countries. The value of currency of western countries is much higher as compared to Indian currency. Consequently, Indians get attracted towards these countries. Doctors, Engineers, I.T. Professionals always try to migrate to earn more money. That’s why many Indians migrate each year to different countries.
2. Punjab’s Position. Like other Indians, Punjabi’s also prefer to mirgrate. A number of males of Jalandhar Doab region have already migrated to western countries and then they took their families with them. Their favourite destinations are Australia, U.S.A. Canada and England. They get attracted towards Dollars and leave no earth and stone to migrate from India.
If Punjabis are migrating to other countries then many people are also coming to Punjab. These are .those migrated labourers who come from the states like U.P. Bihar etc. to earn more money. They either work in industries or in agricultural fields. In 2011, around 21,30,262 people came to Punjab which become 8.7% of the total population of Punjab.
Question 3.
Describe the population density of India.
Answer:
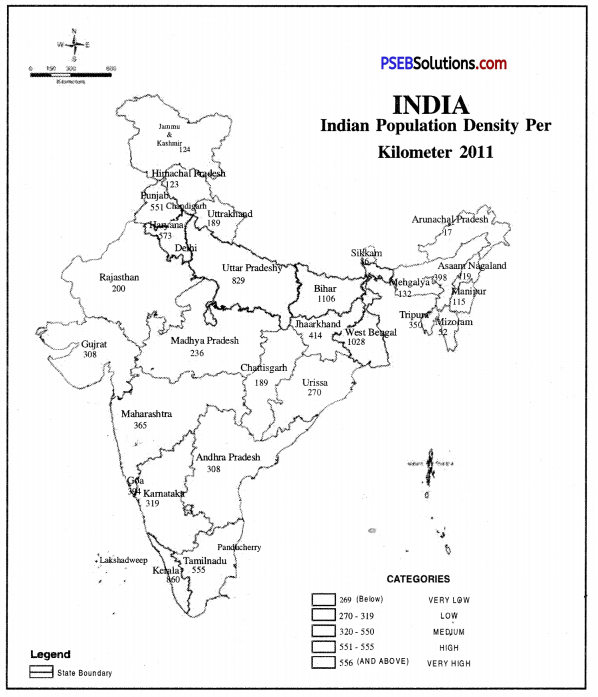
The distribution of population in India is very unequal. According to 2011 census the total population of India is 121 crores and the density of population is 382 persons per sq. kilometre. The density of population varies according to relief, climate and the agricultural productivity of the land. The density of population depends on the amount of rainfall. The areas of sufficient rainfall can support a large number of people.
1. Densely populated areas. These areas have a density of more than 400 persons per sq. kilometre. The high density areas makes a girdle round the Deccan plateau. Right from Satluj-Beas plain to Brahmaputra valley, the density of population is very high.
(а) West Coastal Plain. Kerala has 860 persons per sq. kilometre density of population.
(b) The East Coastal Plain. Tamil Nadu has a density of 555 persons per. sq. kilometre.
(c) The Northern Plain. It includes West Bengal (1028), Bihar (1106) , Uttar Pradesh (829), Punjab (551).
Factors favouring high density.
- Sufficient rainfall
- Fertile river valleys and deltas
- 2 to 3 crops of rice in a year
- Healthy climate
- Rich in minerals and power resources.
2. Moderately populated areas. These include the areas with a density between 200 to 400 persons per sq. kilometre. These areas are surrounded by Eastern Ghats and Western Ghats. Haryana (573) Maharashtra (365), Andhra Pradesh (308), Karnataka (349), Gujarat (308), Orissa (270), Goa (394), Assam (398) have a moderate density.
Factors for moderate density.
- Agriculture is not developed due to thin and rocky soils.
- Rainfall is uncertain
- Means of transportation are not developed.
- Some areas have high density of population due to irrigation, lava soils and mineral resources.
3. Sparsely Populated Areas. These areas have a density less than 200 persons per sq. kilometre.
(a) North-Eastern India. This region includes Meghalaya (132), Manipur (115), Nagaland (119), Sikkim (86) and Arunachal (17).
(b) Rajasthan Desert. Rajasthan has a density of 200 persons per sq. kilometre.
(c) Western Himalayas. It includes Jammu and Kashmir (124), Himachal Pradesh (123).
![]()
Question 4.
Discuss Indian population from health and population fronts.
Answer:
1. Health. Health is considered as one of the important aspect of population structure which affects the development process of a country. Due to continuous government efforts, people’s health is continuely improving. In 1951, death rate was 25 per 1000 but in 201 h, it reduced to 7.9 per thousand. In the same way average age in 1951 was 36.7 years which also increased to 65.2 years in 2011.
This important change came due to many factors such as health of people, security from many diseases, using modern facilities etc. Government has opened up thousands of hospitals, dispensaries, health centres to provide better health services to the people. Even then health is a major cause of concern for us. Per capita calorie consumption is still quite less. A large portion of our population is still unable to get nutritious food. Clean drinking water and basic health facilities are still a distinct reality for large number of people. To remove such problems, a proper population policy is required.
2. Occupation. The percentage of working population in economy is an important indicator of development. Division of population on the basis of different occupations is called occupational structure. People are actually engaged in different occupations which are divided in three parts—primary, secondary and tertiary.
(а) Primary occupations. It includes agriculture, pastoralism, fishing, mining etc.
(b) Secondary occupations. It includes industries, construction etc.
(c) Tertiary occupations. It includes those people who give their services to the people such as administration, banking, insurance sectors etc.
The proportion of people engaged in different occupations is different in developed and developing countries. In developed countries, more people are engaged in secondary and tertiary sectors. But in developing countries, more people are engaged in primary sector. In India, 53% people are engaged in primary sector, 13% in secondary sector and 20% in tertiary sector. During recent times, this number has witnessed a continues change due to development of industrialization and urbanization.
PSEB 9th Class Social Science Guide Population Important Questions and Answers
Multiple Choice Questions :
Question 1.
India stands at___________place in the world from population point of view.
(a) Second
(b) Fourth
(c) Fifth
(d) Ninth.
Answer:
(a) Second.
Question 2.
How much of India’s population lives in Punjab?
(a) 1.3%
(b) 2.3%
(c) 3.2%
(d) 1.2%.
Answer:
(b) 2.3%.
Question 3.
How much of India’s population lives in rural areas?
(a) 70%
(b) 75%
(c) 78%
(d) 68%.
Answer:
(d) 68%.
![]()
Question 4.
Punjab’s densities of population in 2011 was
(a) 888
(b) 944
(c) 551
(d) 933.
Answer:
(c) 551.
Question 5.
In 2011, how many females were there behind every 1000 males?
(a) 943
(b) 933
(c) 939
(d) 894.
Answer:
(a) 943.
Question 6.
Which Indian state has highest density of population?
(a) Uttar Pradesh
(b) Bihar
(c) Rajasthan
(d) Tamil Nadu.
Answer:
(b) Bihar.
Question 7.
Which Indian state has least density of population?
(a) Mizoram
(b) Sikkim
(c) Arunachal Pradesh
(d) Nagaland.
Answer:
(c) Arunachal Pradesh.
Question 8.
What was sex ratio of Punjab in 2011?
(a) 943
(b) 866
(c) 872
(d) 895.
Answer:
(d) 895.
Question 9.
Which Indian district has highest population?
(a) Thane
(b) Uttar Chaubis Pargana
(c) Dibang Ghati
(d) Anjah.
Answer:
(a) Thane.
![]()
Question 10.
Which of these is the reason of migration?
(a) Search of employment
(b) Religious Freedom
(c) Political Freedom
(d) All of these.
Answer:
(d) All of these.
Fill in the blanks :
Question 1.
In 2011, India’s total urban population was ___________
Answer:
35 crore
Question 2.
In rural areas, the percentage of labourers is _________
Answer:
40%
Question 3.
In 2011, India’s density of population was _________ persons per sq.km.
Answer:
382
Question 4.
The percentage of labourers in India is _________
Answer:
37.50
Question 5.
_________ state has maximum percentage of labourers.
Answer:
Andhra Pradesh
Question 6.
The population in the age group of 15-65 years is
Answer:
58.4.
True/False :
Question 1.
India holds first place in the world from population point of view.
Answer:
False
![]()
Question 2.
Population in mountainous and desert regions is quite dense.
Answer:
False
Question 3.
In poor countries, more population comes in the age group of 10-14 years.
Answer:
True.
Question 4.
India’s sex ratio is quite less.
Answer:
True.
Question 5.
Natural growth in population depends upon the difference in birth rate and death rate.
Answer:
True.
Very Short Answer Type Questions
Question 1.
What is meant by Density of Population?
Answer:
An average number of people living in square kilometres is known as density of population.
Question 2.
Which is the major factor affecting population distribution in India?
Answer:
Agricultural productivity.
Question 3.
Name any two parts of India with a dense populations.
Answer:
Upper Ganga Valley and Malabar region.
Question 4.
Which areas of India has less density of population?
Answer:
North-eastern states, western Rajasthan, few parts of Gujarat etc.
![]()
Question 5.
What are the adverse consequences of increasing population in urban areas?
Answer:
Pressure on available resources and public facilities.
Question 6.
What is meant by sex ratio?
Answer:
Number of females after every 1000 males in any area is called sex-ratio.
Question 7.
What is meant by working population?
Answer:
Working population is that population which is engaged in different occupation to earn money.
Question 8.
What is dependent population?
Answer:
All those children and old age persons come in dependent population who cannot earn and are dependent on working population.
Question 9.
Give reason of decreasing death rate.
Answer:
The spread of health services by the government.
Question 10.
Name the Indian state with least population.
Answer:
Sikkim.
Question 11.
What is the density of population in India?
Answer:
382 persons per sq.km.
![]()
Question 12.
What is the density of population in West Bengal?
Answer:
1028 persons per sq.km.
Question 13.
Which state has highest density of population?
Answer:
Bihar.
Question 14.
Which state has highest population in India?
Answer:
Uttar Pradesh.
Question 15.
What is density of population in Delhi?
Answer:
11297 persons per sq.km.
Question 16.
What was sex ratio in India in 2011?
Answer:
943 persons after every 1000 males.
Question 17.
Which state in India has highest literacy rate?
Answer:
Kerala.
Question 18.
Which state has lowest density of population?
Answer:
Arunachal Pradesh.
![]()
Question 19.
What is the most important and valuable resource of a country?
Answer:
The people of the country healthy, mentally as well as physically is the biggest natural source of a country.
Question 20.
What were the causes of slow increase in population before independence?
Answer:
The causes of this normal growth are epidemics, wars and famines which increase death rate.
Question 21.
What was the population of India in the year 1901?
Answer:
The population of India was 23,83,96,327 (23.8 Crore) in the year 1901.
Question 22.
What is the population of India in the year 2011?
Answer:
The population of India was 121 crores in the year 2011.
Question 23.
What is rank of India in the world from the point of view of populations?
Answer:
India ranks second in world (after China) in the view of population.
Question 24.
Write the name of the states with highest and lowest population.
Answer:
Uttar Pradesh has the highest population (19.9 crore) and Sikkim has the lowest population to (6 lakh) in India.
![]()
Question 25.
Name the states which have a population of more than 5 crores.
Answer:
There are 10 states of India in which population is more than 5 crores.
Question 26.
What was the population of Punjab in the year 2011 and what is the rank of Punjab from the population point of view?
Answer:
The population of Punjab was 2.77 crores in the year of 2011 and Punjab ranks 15th in the country in the view of population.
Question 27.
What percentage of population of India lives in Punjab?
Answer:
Almost 2.3 percent of total population of country live in Punjab.
Question 28.
How many cities are there in India with a population of more than one lakh?
Answer:
There are 302 cities in India with the population of more than one lakh.
Question 29.
How much per cent of population of our country live in plains?
Answer:
40% of population of the country lives on the plains.
Question 30.
How much percentage of population of the country lives in villages?
Answer:
More than 68% of population of the country lives in the villages.
Question 31.
What is the average density of population in our country?
Answer:
The average density of population in India is 382 persons per square kilometres.
![]()
Question 32.
Name the states having highest and lowest density of population.
Answer:
Bihar is the state with highest density of population (1102) and Arunachal Pradesh is the state with lowest density of population (17) in India.
Question 33.
What is the density of population in Punjab?
Answer:
The density of population is 551 persons per square kilometre in Punjab. Question 34. Which union territory has the highest.density of population? Answer:National Capital Area Delhi has the largest density of population (11297).
Question 35.
Name the elements that determine the age structure.
Answer:
The factors which determine the age structure are :
- Fertility
- Mortality
- Migration.
Question 36.
What is percentage of population that fall in the 0-14 years age group in our country?
Answer:
37.2% of population is found in the country with the age of 0-14 years.
Question 37.
What percentage of population falls in the 15-64 years age group in our country?
Answer:
58.4% of population is found in the country with the age group of 15-65 years.
Question 38.
What do you understand by sex ratio?
Or
What is meant by sex ratio?
Answer:
The number of women per thousand men is sex ratio.
Question 39.
What is sex ratio of the population of the year 2011?
Answer:
The sex ratio is 943 females for 1000 males in India according to 2001 census.
Question 40.
What are the rural and urban sex ratio?
Answer:
The sex ratio is 939 in rural areas and is 894 per thousand men in urban areas in the year of 2011.
![]()
Question 41.
Give two reasons decreasing sex ratio in India.
Answer:
Female foeticide and lower status of females in India.
Question 42.
What is birth rate?
Answer:
Number of births behind every 1000 persons in a particular area is called birth rate.
Question 43.
What is death rate?
Answer:
Number of deaths behind every 1000 persons in a particular area is called birth rate.
Question 44.
What is migration?
Answer:
When a person leaves his geographical area moves to other area to live is called migration.
Question 45.
What is adolescent age?
Answer:
Age between 10-19 years is called adolescent age.
Question 46.
Give one problem of adolescent age.
Answer:
Many physical changes come in this age and children feel quite awkward.
Question 47.
Why migrant labourers come to India?
Answer:
To earn money by working in industries and in agricultural fields.
Question 48.
From which states did migrant labourers come to Punjab?
Answer:
Uttar Pradesh, Bihar, Jharkhand, West Bengal etc.
Question 49.
Which district of India have highest and lowest population?
Answer:
Highest Population: Thane (Maharashtra)- 1,10,60,148 persons.
Lowest Population: Dibang Ghati (Arunachal Pradesh)-8004 persons.
Question 50.
What is literacy rate in India?
Answer:
In 2011, literacy rate in India was 74.04%.
Question 51.
Which district of Punjab has highest sex ratio?
Answer:
Hoshiarpur-1000: 961.
![]()
Question 52.
Which district of Punjab has highest literacy rate?
Answer:
Hoshiarpur-84.16%.
Short Answer Type Questions
Question 1.
What do you mean by Census Survey? Write a note on it.
Answer:
Indian government conducts counting of population after every ten years which is called census survey. In this, information is collected about the age, sex, house, literacy rate etc. First census in India was held in 1872 and after this, census is held in the first year of each decade. The census of 2011 was 15th census survey in which? 2200 crore were spent and 27 lakh officer conducted this survey.
Question 2.
What is the difference between Regional distribution of Population and density of population?
Answer:
Distribution of population refers to a place or area, but density of population refers to a ratio. Distribution reflects a pattern of population. It shows Whether population is scattered or concentrated at a place. But density of population shows size of population ratio between men and land.
Question 3.
What are the factors that affect the distribution of population?
Answer:
Population in India is not evenly distributed many factors are responsible for this.
- Fertility of the soil. The states in which there is a large fertile area the density of population is high. U.P. and Bihar are such states.
- Amount of rainfall. The density of population is higher in regions of abundant rain. In northern India the amount of rainfall goes on decreasing from east to west. The density of population also goes on decreasing in the same direction.
- Climate. Wherever the climate is congenial the density of population will be high. In Assam even though there is abundant rainfall but the density of population is low because the climate is unhealthy. The malaria is always there is an epidemic form.
- Developed means of transportation. With the development of means of transportation the business makes rapid progress and the density of population increases. The reason for high density of population in U.P., Bihar and West Bengal is the development of means of transportation.
Question 4.
Why is India known as country of villages?
Answer:
There is no doubt that India is a country of-villages.
- Most of people live in villages.
- 3/4th of population lives in rural areas.
- There are more than 5 lakh and 50 thousand rural settlements but 71% of urban population lives in 302 towns.
- About 40.1% of labourers live in rural areas and 30.2% of labourers live in urban areas.
![]()
Question 5.
What are characterisitc features of regional distribution of population?
Answer:
Characteristics :
1. The distribution of population is uneven in India. There is dense population in river valleys and coastal plains. There is space population in hilly, deserts areas and drought affected areas, 16% of the area of the country, in the Northern plains only 3% people of India live. 94% of population lives on an area of 18% in plains. Only 2% population lives on an areas of 6% in Rajasthan.
2. Most of the people live in villages. Only 31% people live in urban areas.
3. A large part of minorities live in sensitive border area. Along the N.W. border of India. Sikhs in Punjab and Muslims in J & K. form a majority community. Along the borders of China and Burma, in the North East, mostly Christians are found. It has created many political economic and social problems.
4. On the one hand, there is concentration of population in river valleys and coastal areas but deserts, hilly areas are sparsely populated. It looks like a demographic divide.
Question 6.
What do you mean by density of population? Tell something about density of population in India.
Answer:
Persons living in a square kilometre is called density of population. How many persons live in a particular area, will be known only by looking at density of population. According to Census survey of 2011, population density in India was 382 persons per sq.km. There are many Indian states where density of population is quite high such as Bihar (1106), West Bengal (1028), Kerala (860), Uttar Pradesh (829), Punjab (551) etc. But there are few states in which there is quite less density of population such as Nagaland (119), Sikkim (86), Mizoram (52), Arunachal Pradesh (17) etc. Delhi’s density of population is 11297 which is highest among all the union Territories.
Question 7.
Write a note on population Growth.
Answer:
Population of a place or a country never remains the same but it changes from time to time. That’s why when positive changes come at a particular place on a particular time, it is called population growth. This population growth can be due to many reasons such as birth rate, death rate, migration of people etc. The population growth of India between 2001 to 2011 was 17.68% and that of Punjab was 13.9%. Population growth can be calculated with a formula :
Population Growth = \(\frac{\text { Pure growth in Ten Years }}{\text { Total population }}\) × 100
Question 8.
Name few factors responsible for population growth.
Answer:
Many factors are responsible for population growth such as:
- If birth rate is more than death rate then population increases.
- If girls get married at an early age then there is a possibility of population growth.
- If climate is positive for life then also there will be an increase in population.
- Universality of marriage is also responsible for population growth.
Question 9.
Write a note on Age composition.
Answer:
The process of dividing population of a place, state or country in different age groups is called age composition. Generally, whole of the population is divided in three groups. In first group, people with the age of 0-14 years are included. In the second group, people with the age of 15-84 years are included which is known as working class. Third group includes people with the age of 65 years or above which is known as dependent group. First and third group are dependent upon second group for their needs. Dependency ratio can be expresses with a formula :
Dependency Ratio = \(\frac{\text { No. of children }+\text { No. of old Age people }}{\text { No. of Adults }}\) × 100
Question 10.
What is sex-ratio? Explain sex ratio in India.
Answer:
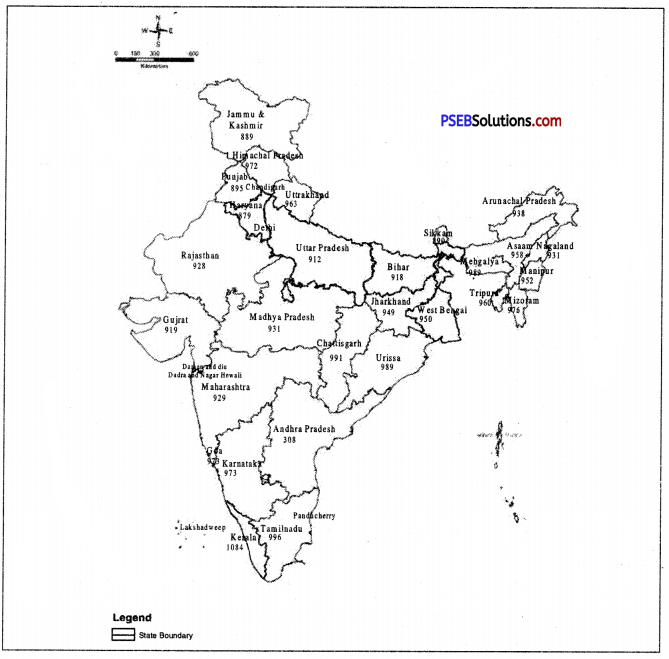
Number of females behind 1000 males in a particular area is known as sex ratio. In 2011, sex ratio in India was 1000 : 943 means there were 943 females behind every 1000 males. Sex ratio in India was always low. Only Kerala (1084) and Puducherry (1037) has positive sex ratio but it is negative in other states. In Punjab (895) and Haryana (879), it was quite less. If we want to know about the status of women in any society, we must look in for sex ratio of that place. But during last few decades, it is continuely improving due to official efforts.
Question 11.
What are the causes of low sex Ratio in India?
Answer:
The sex ratio of India is 943 per thousand males. There is a general declining trend in sex ratio. The ratio in 1901 was 972. It was declined to 934 in 1981. This decline has been due to social evils in our society.
In our society, female child is neglected. Male population dominates in our society. There is high death rate among females. Death rate is particularly high among married women. Women labour migrates to some mining and industrial centres. It also results in declining sex ratio.
![]()
Question 12.
What is the Sex ratio of States of North India?
Answer:
There is an adverse sex ratio in Northern India. The number of females is less than that of males. It is clear from sex ratio in Bihar (916), Rajasthan (926), Punjab (895), U.P. (898), and Haryana (877). (The lowest Sex Ratio in India).
Question 13.
What is the importance of Economic Structure of population?
Answer:
Importance
- We come to know the percentage of people engaged in productive \york.
- It shows the cultural composition of population which determines the stage of development of a country.
- It marks the backward areas of the country so that proper planning can be done.
Question 14.
Why is it necessary to study the structure of population?
Answer:
It is necessary to study the structure of the population of a country due to :
1. We need different components of population such as age structure, sex ratio, occupational structure for the economic and social planning of a country.
2. The different aspects of population have a close relationship with developoment on the one hand. These are affected by population and on the other hand these affect population and development. For example, if the percentage of children and old age people is high in age structure, a country has to spend more on education and health facilities. On the other hand, a high percentage of working age group encourages the economic development of a country.
Question 15.
What are the importance of study of age structure?
Answer:
These are the advantages of study of age structure of population :
1. By determining the 0-14 age group the govt, knows that there is need of expenditure on education, health and social services. So new schools, health centres and community centres are opened.
2. We know the number of eligible voters in the country which is vital for a democracy. There should be 58% voters per age group, but actually there are 60% of voters in the country.
Question 16.
Write about the needs of adolescents in adolescent age.
Answer:
- Adolescents must get good and balanced diet.
- They must be given proper environment and proper education.
- They must be informed about physical changes.
- Parents and society must talk with them with great love and affection.
- Efforts must be made to save them from drug addiction.
- They must be provided with proper guidance for a good future.
Question 17.
What is the role of society, teachers and parents in making future of adolescents?
Answer:
- Parents can provide good education and environment to their children to give them a bright future.
- Parents can show them the way to make their children better citizens, to remain away drugs etc.
- Teachers can motivate their students to become good citizens by giving them proper education.
- Social, Religious and Political leaders can motivate their students to move on a right path.
![]()
Question 18.
Write a note on gender based structure of Punjab.
Answer:
Punjab’s total population is 2,77,43,338 out of which 1,46,39,465 are males and 1,310,3873 are females. Their sex ratio is 1000 : 895. It means that after every 1000 males, there are 895 females which is quite less. This is 875 in cities and 907 in village which is little bit more in comparison to 2001. Sex ratio of Hoshiarpur district (961) is at the top and then it comes Shaheed Bhagat Singh Nagar (954)), Jalandhar (915) and Roop Nagar (915). Bathinda (868) has the lowest sex ratio. Then it comes the number of Fathegarh Sahib (871). During last decade, this sex ratio has increased due to strict official efforts.
Question 19.
Throw a light on the occupational structure in Punjab.
Answer:
Agriculture is the major occupation of the people of Punjab and that’s why most of the population is engaged in agriculture or related acitvities. Out of total workers of Punjab, 35.5% are engaged in agriculture or related activities 3.9% people are engaged in household industries. Rest of the 60.5% people are engaged in other activities. In the districts of Sri Muktsar Sahib and Mansa, most of the workers are engaged in agriculture but in Ludhiana and Sahibzada Ajit Singh Nagar, very few people are engaged in agriculture but rest are busy in industrial and service sector. A number of Punjabi’s have migrated to other countries in search of employment.
Question 20.
Give cause of Declining Sex Ratio.
Answer:
- People want to have a boy child and they never hesitate to abort the female foetus. It leads to decline in sex ratio.
- Sex ratio declines with increase in female foeticide.
- Sex ratio declines with the custom of killing new born girls i.e. female infanticide.
- Emigration of males from one place to another also leads to decline in sex ratio.
- In traditional societies birth of girl is considered as a curse because of which boys are preferred over girls. It also leads to decline in sex ratio.
Question 21.
Give consequences of Declining Sex Ratio.
Answer:
- Declining Sex ratio leads to increase in violence against women.
- The custom of polyandry encouragement with declining sex ratio.
- Declining sex ratio leads to lower social status of women.
- Health of women deteriorates with it.
- Trade of women also takes place with declining sex ratio.
Question 22.
Which are the states those have high density of population?
Answer:
There is dense population in Northern plains, western coastal plain, Eastern Coastal plain (Deltas). These area have fertile soils and facilities of irrigation. So the population is dense. As we go westward, the rainfall goes on decreasing and the density of population also decreases. That is why the density of population in West Bengal is greater than that in Haryana and Punjab. Kerala has also high density because two or three crops can be grown due to high rainfall.
Question 23.
What are the causes of high density of population in plains?
Answer:
The density of population is high in plains. This is due to :
- The Northern plain is fertile.
- It has high rainfall.
- It has many big industrial centres.
- The means of transport are developed.
- Coastal plain has the facilities of fishing and foreign trade.
Question 24.
What are the areas of low density of population?
Answer:
Thar Desert, Eastern Himalayas and Chotta Nagpur plateau are sparsely populated areas.
- The soils are infertile or sandy or stony.
- The means of transport are not developed.
- The climates is not healthy. It is either too hot or too cold. Himalayas get heavy rainfall.
- Industries are not developed in these areas except Chotta Nagpur plateau.
Long Answer Type Questions
Question 1.
Explain in detail the state wise structure of sex ratio in India.
Answer:
Sex ratio means the number of females per 1000 males. Now a days, women have equal rights with men. In developed countries, the number of women is equal to number of men. In some countries sex ratio is 1050. The average sex ratio in developing countries is 964. In India, in 2011, sex ratio was 940, and is one of the lowest in the world.
State-wise sex ratio. Sex ratio is not uniform in all states. Only one state, Kerala, has sex ratio of 1084 and Puducherry (1036) (Above the average). In other states, sex ratio is less than average.
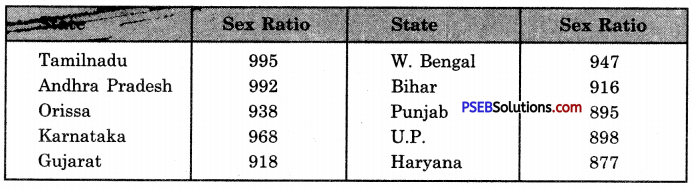
It is clear that Northern States have low sex ratio and it is a matter of concern.
Question 2.
List factors influencing distribution of population.
Answer:
The following factors influence the distribution of population :
1. Fertility of the soil. The states in which there is a large fertile area, the density of population is high. U.P. and Bihar are such states.
2. Amount of rainfall. The density of population is higher in regions of abundant rain. In northern India, the amount of rainfall goes on decreasing from east to west. The density of population also goes on decreasing in the same direction.
3. Climate. Wherever the climate is congenial, the density of population will be high, In Assam even though there is abundant rainfall but the density of population is low because the climate is unhealthy. The malaria is always in an epidemic form.
4. Developed means of transportation. With development of means of transportation the business makes rapid progress and the density of population increases. The reason for high density of population in U.P., Bihar and West Bengal is the development of means of transportation.
5. Industrial development. At places where the factories are located, the density of population also increases. The reason is that people like to live in those areas where industrial development takes place. They can carry on their business more easily in such areas, and they have better chances of earning more money. That is why the density of population is high in Delhi, Mumbai and Kolkata.
![]()
Question 3.
Write an essay on problem of population increase in India and also enlighten the solution to this problem.
Answer:
India’s population is growing rapidly, and creating some problems.
1. Low standard of living. Indian people have low standard of living as compared that of Europeans. About 48% people live below poverty line. They do not have full meals. It results in low production capacity.
2. Deforestation. The forests are cleared rocklessly to meet the growing needs. It has resulted in problems of soil erosion floods, pollution and loss of forest- wealth.
3. Lack of pastures. India has only 4% land under pastures. If this land is used for other purposes, it will result in shortage of fodder for cattles.
4. Pressure on population. Land is a limited source and cannot be increased. It is leading a pressure of population on land. It will decrease the productivity of the land.
5. Lack of minerals. Industries are developed to meet the growing needs of people. So more minerals are used. These reserves will exhaust soon.
6. Environment. Population growth has an adverse effect on environment. Clear water and air is a problem. Oxygen is also decreasing.
Solutions:
- Family planning should be adopted,
- People should be explained the significance of small families by films, songs, plays,
- Illiteracy should be abolished so that people should understand harms of growing population.
- Female education should be increased, marriageable age of girls be increased.
Question 4.
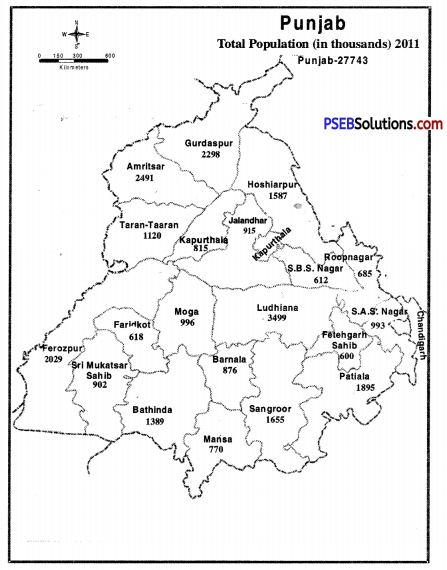
Write a note on population distribution in Punjab.
Answer:
Punjab’s total population is 2,77,43,338 and this population lives in 12,581 villages and 217 big small cities. Few areas of Punjab has more concentration of population and few areas have less concentration. Cities like Ludhiana and Amritsar have more population i.e. 16 Lakhs and 11 Lakhs respectively. But the population of few cities is in thousands. On the basis of population density Punjab can be divided in four parts and these are :
1. Areas with less density of population. In first category, those districts are included where population density is less than 400 persons per square kilometre. Sri Muktsar Sahib is included in this category whose population density is 348 which is quite less than other districts.
2. Moderate density of population. Those districts are included in this category which has a population density of 401-500 persons per sq. km. It includes many districts such as Taran Taran, Hoshiarpur, Faridkot, Shaheed Bhagat Singh Nagar, Moga, Faridkot, Barnala, Bathinda, Sangrur, etc.
3. More density of population. The third category includes the districts of Patiala, Fatehgarh Sahib, and Roop Nagar where the density of population is between 501-600 persons per sq. km.
4. Extreme Density of population. It includes such districts whose density of population is more than 600 persons per sq. km. The districts of Amritsar, Gurdaspur, Ludhiana, Jalandhar, Sahibzada Ajit Singh Nagar are included in this category. Ludhiana’s density of population is 978 which is the highest in Punjab. Then comes the number of Amritsar (928) Sahibzada Ajit Singh Nagar (909) and Jalandhar (836).