Punjab State Board PSEB 7th Class Maths Book Solutions Chapter 3 Data Handling Ex 3.3 Textbook Exercise Questions and Answers.
PSEB Solutions for Class 7 Maths Chapter 3 Data Handling Ex 3.3
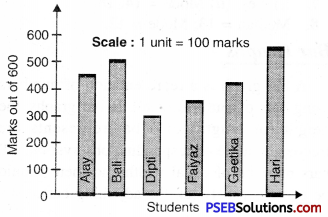
1. Following data gives total marks (out of 600) obtained by six students of a particular class. Represent the data on a bar graph.
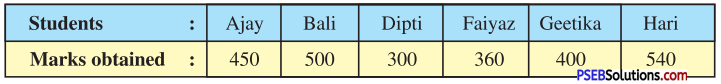
Solution:
(i) To choose an appropriate scale we make equal division taking increments of 100.
Thus, 1 unit represent 100 marks.
(ii) Now represent the data on the bar graph.
2. The following bar graph shows the number of books sold by a bookstore during five consecutive years. Read the bar graph and answer the following questions :
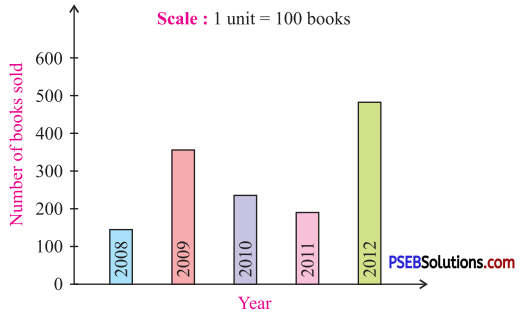
Question (i).
About how many books were sold in 2008, 2009 and 2011 years ?
Solution:
140; 360; 180,
Question (ii).
In which year about 475 books were sold ? And in which year about 225 books were sold ?
Solution:
2012; 2010.
![]()
3. Two hundred students of 6th and 7th class were asked to name their favourite colour so as to decide upon what should be the colour of their school building. The results are shown in the table :
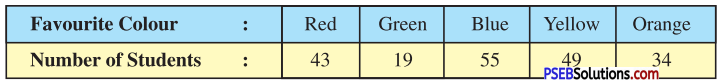
Represent the data on a graph.
Answer the following questions with the help of bar graph :
Question (i).
Which is the most preferred colour ?
Answer:
Choose a suitable scale as follows :
Start the scale at 0. The greatest value in data is 55, so end the scale at a value greater than 55, such as 60.
Question (ii).
Which is the least preferred colour ?
Answer:
Use equal divisions along the vertical axis, such as increments = 10. All the bars would between 0 and 60. We choose the scale such that the length between 0 and 60 is neither too long nor too small. Here we take 1 unit for 10 students.
Question (iii).
How many colours are there in all ? What are they ?
Answer:
We then draw and label the graph as shown :
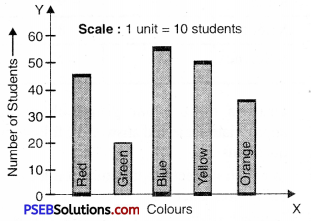
From the graph we conclude that :
- Blue is the most preferred colour Because the bar representing Blue is the tallest).
- Green is the least preferred colour (Because the bar representing Green is the shortest).
- There are five colours. They are Red, Green, Blue, Yellow and Orange.
![]()
4. Consider the following data collected from a survey of a colony :
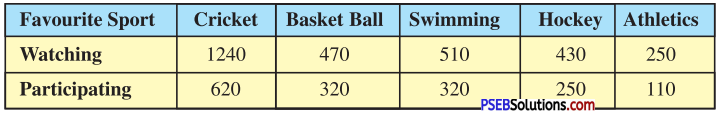
Draw a double bar graph choosing an appropriate scale.
What do you infer from the bar graph ?
(i) Which sports is the most popular ?
(ii) Which is more preferred, watching or participating in sports ?
Solution:
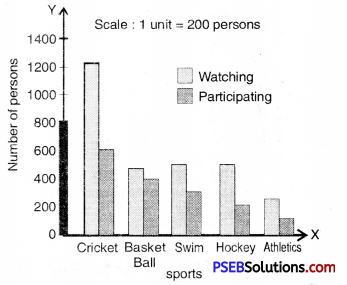
Take different sports along X = axis and number of persons watching and participating favourite sports Y-axis.
Scale. Take 1 unit height along Y-axis = 200 persons. The double bar graphs representing the given data is shown below.
![]()
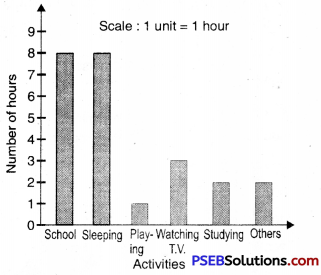
5. The following table shows the time (in hours) spent by a student of class VII in a day.
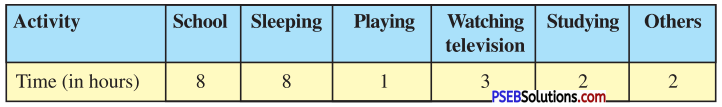
Draw a bar graph to represent the above data. What do you infer from the above table ?
Solution:
Choose a suitable scale as follows :
(i) Start the scale at 0. The greatest value in the data is 8, so end the scale at a value greater than 8, such as 9. Take 1 unit of height of bars.
(ii) Use equal division along vertical axis, such as increments is 10. All the bars would be between 0 and 9.
(iii) We then draw and label the graph as below :