Punjab State Board PSEB 6th Class Maths Book Solutions Chapter 14 Data Handling Ex 14.3 Textbook Exercise Questions and Answers.
PSEB Solutions for Class 6 Maths Chapter 14 Data Handling Ex 14.3
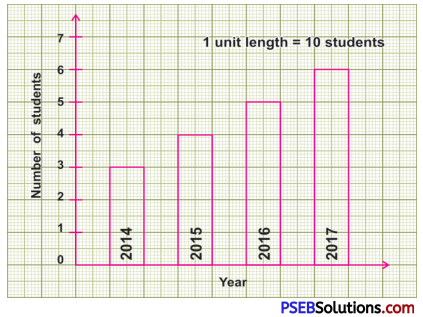
1. Read the following bar graph showing the number of students in a particular class of a school:
Answer the following questions:
Question (i)
What is the scale of this graph?
Solution:
Scale used 1 unit = 10 students
![]()
Question (ii)
How many students are there in 2016?
Solution:
Number of students in year 2016 = 50
Question (iii)
Is the number of students in the year 2017 twice the year 2014?
Solution:
Yes:
Number of students in year 2014 = 30
Number of students in year 2017 = 60.
2. Read the bar graph and answer the following questions:
Question (i)
(i) What is the information given by the bar graph?
(ii) Which scale is used in this bar graph?
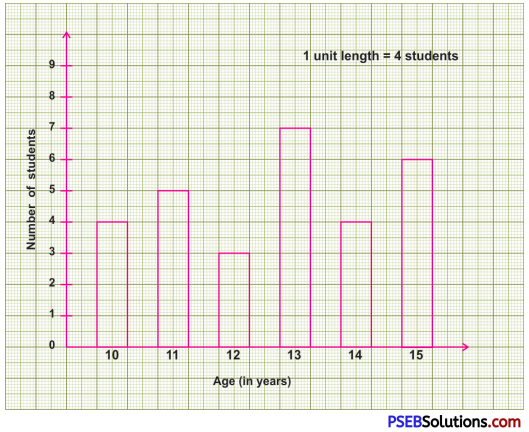
(iii) What is the maximum age? How many students have maximum age?
(iv) How many students have minimum age?
(v) How many students are 13 years old?
Solution:
(i) Age of different students is represented by bar graph
(ii) Scale used : 1 unit = 4 students
(iii) Maximum age =15 years Number of students of maximum age = 24 student.
![]()
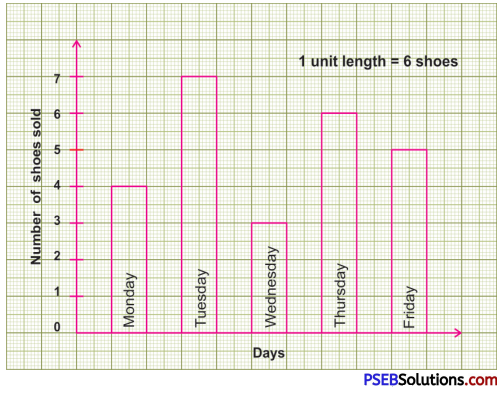
3. Read the given bar graph and answer the following questions:
Question (i)
What information does the bar graph represent?
Solution:
The bar graph represents number of shoes sold in different days.
Question (ii)
What is the scale chosen for this graph?
Solution:
Scale chosen : 1 unit = 6 shoes sold
![]()
Question (iii)
On which day were the maximum number of shoes sold and how many?
Solution:
The day on which maximum shoes sold = Tuesday
Maximum shoes sold = 42 shoes
Question (iv)
On which day were the minimum number of shoes sold and how many?
Solution:
The day on which minimum shoes sold = Wednesday
Minimum shoes sold = 18 shoes
Question (v)
How many shoes were sold on Thursday?
Solution:
Shoes sold on Thursday = 36 shoes.
4. Read the bar graph which shows the number of books of different subjects in a library:
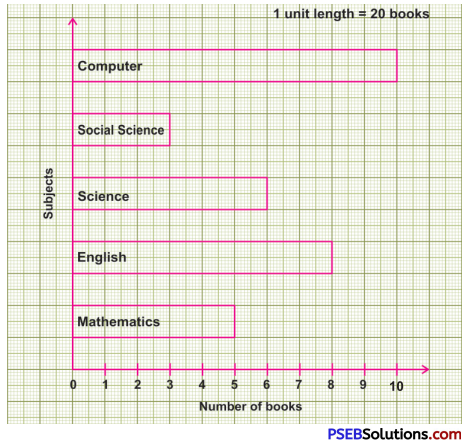
Answer the following questions:
Question (i)
What information does the bar graph gives?
Solution:
The bar graph gives the information of number of books of different subjects in the library.
![]()
Question (ii)
What is the scale chosen for this graph?
Solution:
Scale chosen : 1 unit = 20 books
Question (iii)
Which subject has maximum number of books and how many?
Solution:
Subject which has maximum number of books = Computer
Maximum number of books = 200 books
Question (iv)
Which subject has minimum number of books and how many?
Solution:
Subject which has minimum number of books = Social Science
Minimum number of books of social science = 60 books.
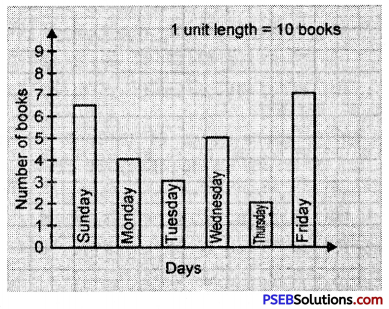
5. The number of Mathematics books sold by a shopkeeper on the different days are shown below:
| Days | Number of books sold |
| Sunday | 65 |
| Monday | 40 |
| Tuesday | 30 |
| Wednesday | 50 |
| Thursday. | 20 |
| Friday | 70 |
![]()
Question (i)
Draw a bar graph to represent the above information choosing the scale of your choice.
Solution: