Punjab State Board PSEB 8th Class Maths Book Solutions Chapter 5 Data Handling Ex 5.1 Textbook Exercise Questions and Answers.
PSEB Solutions for Class 8 Maths Chapter 5 Data Handling Ex 5.1
Question 1.
For which of these would you use a histogram to show the data?
(a) The number of letters for different areas in a postman’s bag.
(b) The height of competitors in an athletics meet.
(c) The number of cassettes produced by 5 companies.
(d) The number of passengers boarding trains from 7:00 a.m. to 7:00 p.m. at a station.
Give reasons for each.
Solution:
We represent those data by a histogram which can be grouped into class intervals. Obviously, for (b) and (d), the data can be represented by histograms.
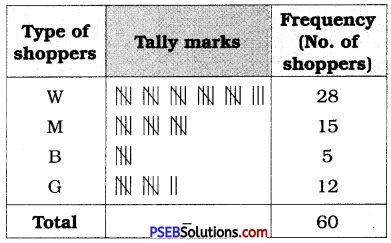
Question 2.
The shoppers who come to a departmental store are marked as: man (M), woman (W), boy (B) or girl (G). The following list gives the shoppers who came during the first hour in the morning:
W W W G B W W M G G M M W W W W G B M W B G G M W W M M W W W M W B W G M W W W W G W M M W W M W G W M G W M M B G G W
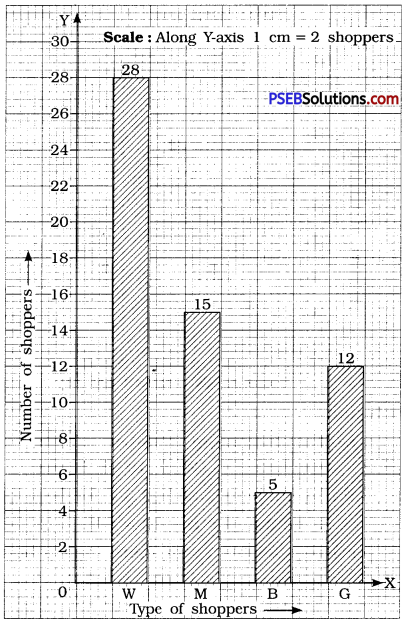
Make a frequency distribution table using tally marks. Draw a bar graph to illustrate it.
Solution:
The frequency distribution table for the above data can be done as follows :
We can represent the above data by a bar graph as given below:
![]()
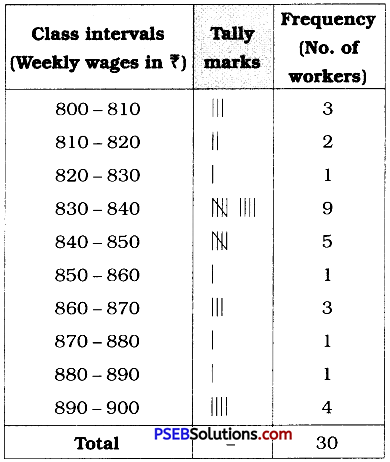
Question 3.
The weekly wages (in ₹) of 30 workers in a factory are:
830, 835, 890, 810, 835, 836, 869, 845, 898, 890, 820, 860, 832, 833, 855, 845, 804, 808, 812, 840, 885, 835, 835, 836, 878, 840, 868, 890, 806, 840
Using tally marks make a frequency table with intervals as 800-810, 810-820 and so on.
Solution:
The lowest observation = 804
The highest observation = 898
The classes are 800-810, 810-820, etc.
∴ The frequency distribution table is
Question 4.
Draw a histogram for the frequency table made for the data in Question 3, and answer the following questions:
(i) Which group has the maximum number of workers?
(ii) How many workers earn ₹ 850 and more ?
(iii) How many workers earn less than ₹ 850 ?
Solution:
The histogram from the above frequency table is given below.
Here we have represented the class intervals along X-axis and frequencies of the class intervals along the Y-axis.
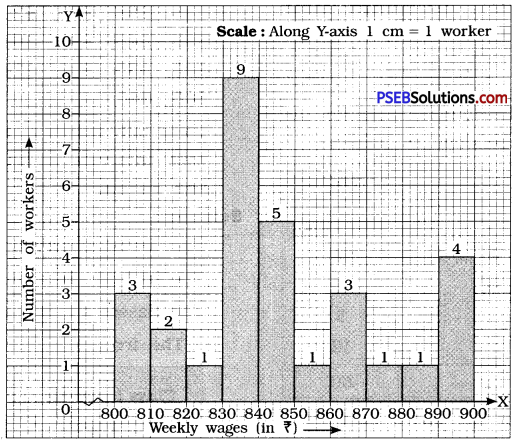
(i) The group 830 – 840 has the maximum number of workers.
(ii) Number of workers earning ₹ 850 or more = 1 + 3 + 1 + 1 – 1 – 4 = 10
(iii) Number of workers earning less than ₹ 850 = 3 + 2 + 1 + 9 + 5 = 20
![]()
Question 5.
The number of hours for which students of a particular class watched television during holidays is shown through the given graph.
Answer the following:
(i ) For how many hours did the maximum number of students watch TV ?
(ii) How many students watched TV for less than 4 hours ?
(iii) How many students spent more than 5 hours in watching TV ?
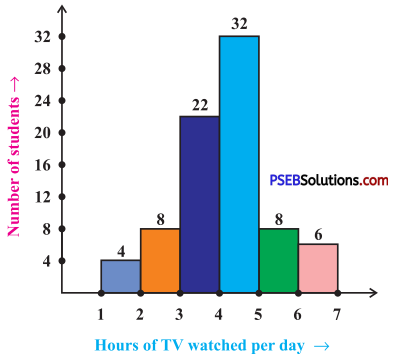
Solution:
(i) The maximum number of students watched TV for 4 to 5 hours.
(ii) 34 students watched TV for less than 4 hours (4 + 8 + 22 = 34).
(iii) 14 students spent more than 5 hours in watching TV (8 + 6 = 14).