Punjab State Board PSEB 5th Class Maths Book Solutions Chapter 10 Data Handling Ex 10.1 Textbook Exercise Questions and Answers.
PSEB Solutions for Class 5 Maths Chapter 10 Data Handling Ex 10.1
Question 1.
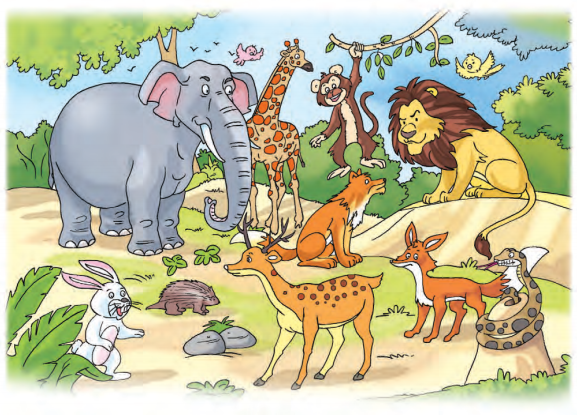
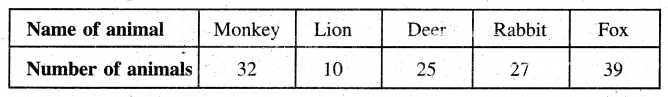
The students of a school visited a zoo for picnic. Students collected the data of number of different animals. The number of animals are as follows : Monkey – 32, Lion – 10, Deer – 25, Rabbit – 27 and Fox – 39. Represent the data in tabular form.

Solution:
We can represent the above information in the tabular form as follows :
![]()
Question 2.
There is a circus in a village. The following pictograph represents the number of children visitors from Monday to Friday. Read the following pictograph carefully and answer the questions.
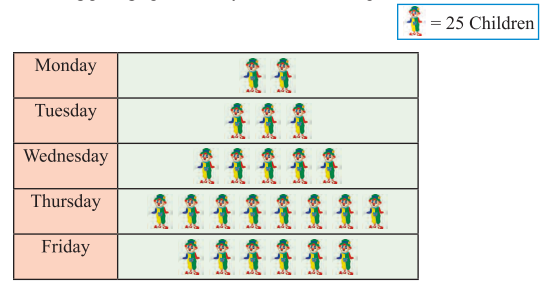
- How many children visited circus on Tuesday ?
- Which day had most children visited and how many ?
- Which day had least children visited and how many ?
- How many total number of children visited the circus on Monday and Wednesday ?
- What is the difference of number of children visited on Thursday and Friday ?
Solution:
- Number of children who visited circus on Tuesday = 3 x 25 = 75.
- The day on which the most number of the children had visited is Thursday and the number of children is 8 × 25 = 200.
- The day on which least number of children had visited = Monday and the number of children = 2 × 25 = 50.
- Total number of children who visited the circus on Monday and Wednesday = 50 + 125=175.
- The difference of number of children who visited on Thursday and Friday = 200 – 150 = 50.
![]()
Question 3.
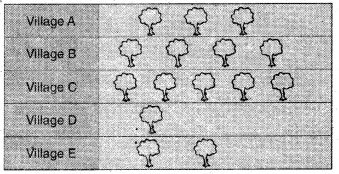
The following table shows the plantation of trees on Diwali day in 5 different villages on the eve of celebration of Green Diwali :
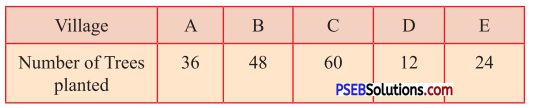
(i) Draw pictograph of the above data.

Solution:
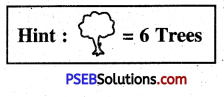
(ii) Draw another pictograph of above information by any other scale.
Solution:
Question 4.
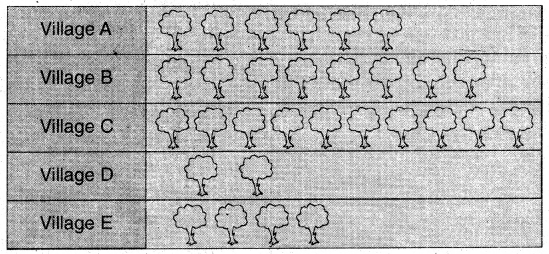
The following Bar Graph represents the quantity of milk used in a week in a sweet shop during the festival season.
- On which day maximum milk is used ?
- On which day minimum milk is used ?
- On which two days, the quantity of milk used is the same and how much ?
- How much total quantity of milk is used on Thursday and Friday ?
- How much less milk is used on Tuesday than Sunday ?
- What is the difference of maximum and minimum quantity of milk used ?
Solution:
- Sunday
- Wednesday
- Monday and Saturday, 150 l
- 550 l
- 350 l – 200 l = 150 l
- 350 l – 100 l = 250 l.
![]()
Question 5.
The data of mobile phones sold of different companies of a shop in October is as follows :
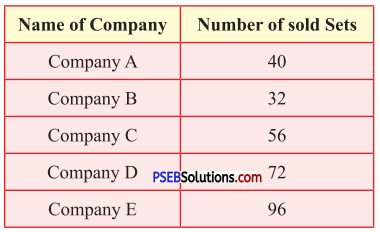
Draw the bar graph for the above data.

Scale : 8 sets = 1 unit
Solution:

Question 6.
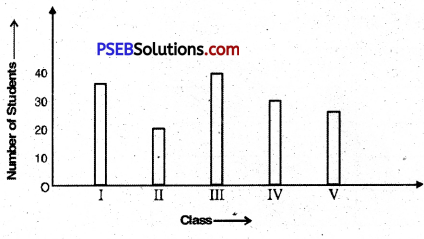
The number of students from 1st to 5th class of a school is as follows:
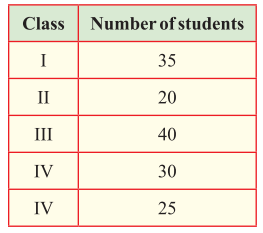
Draw the bar graph for the above data.
Scale : 10 students = 1 unit
Solution:
Question 7.
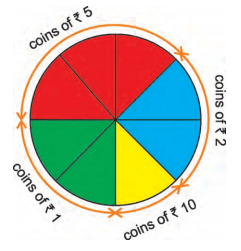
The above Pie Chart is divided into 8 equal parts. It represents the different number of coins in Ajay’s Piggy Bank, then answer the following : If the number of total coins is 80.
(i) How many coins of ₹ 5 are there ? (In fraction)
(ii) How many coins of ₹ 2 are there ?
(iii) Tell the number of coins of ₹ 5 ?
(iv) What is the amount of coins of ₹ 10 ?
(v) How much total amount is there in Ajay’s Piggy bank ?
Solution:
(i) \(\frac{3}{8}\)
(ii) \(\frac{2}{8}\) × 80 = 20
(iii) \(\frac{3}{8}\) × 80 = 30
(iv) Number of ₹ 10 coins = \(\frac{1}{8}\) × 80 = 10
Total value of ₹ 10 coins
= ₹ 10 × 10 = ₹ 100
(v) Number of ₹ 1 coins = \(\frac{2}{8}\) × 80 = 20
Number of ₹ 2 coins = 20
Number of ₹ 5 coins = 30
Number of ₹ 10 coins = 10
Total value of ₹ 1 coins = ₹ 1 × 20 = ₹ 20
Total value of ₹ 2 coins = ₹ 2 × 20 = ₹ 40
Total value of ₹ 5 coins = ₹ 5 × 30 = ₹ 150
Total value of ₹ 10 coins = ₹ 10 × 10 = ₹ 100
The total amount of money in Ajay ’ s piggy bank
= ₹ 20 + ₹ 40 + ₹ 50 + ₹ 100
= ₹ 310.
![]()
Question 8.
Given pie chart is divided into 12 equal parts. It represents the favourite festivals of 120 students of a school. Read it carefully and answer the following :
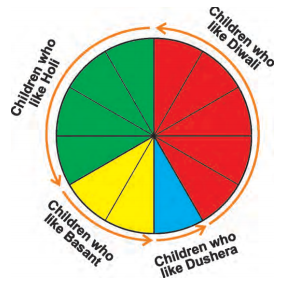
- How many students (in fraction) like Diwali festival ?
- How many students like Holi festival out of 120 students ?
- Which festival is liked by minimum number of students ?
- What is the difference of number of students who like Diwali and Basant ?
Solution:
- \(\frac{5}{12}\)
- \(\frac{4}{12}\) × 120 = 40
- Dussehra
- (\(\frac{6}{12}\) × 120) – (\(\frac{2}{12}\) × 120)
= 60 – 20 = 30