Punjab State Board PSEB 10th Class Maths Book Solutions Chapter Statistics Ex 14.2 Textbook Exercise Questions and Answers.
PSEB Solutions for Class 10 Maths Chapter 14 Statistics Ex 14.2
Question 1.
The following table shows the ages of the patients admitted in a hospital during a year:
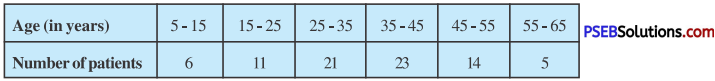
Find the mode and the mean of the data given above. Compare and interpret the two measures of central tendency.
Solution:
For mode:
In the given data, Maximum frequency is 23 and it corresponds to the class interval 35 – 45
Modal class = 35 – 45
So, l = 35; f1 = 23; f0 = 21; f2 = 14 and h = 10
Using fonnula, Mode l = l + \(\left(\frac{f_{1}-f_{0}}{2 f_{1}-f_{0}-f_{2}}\right)\) × h
Mode = 35 + \(\left[\frac{23-21}{2(23)-21-14}\right]\) × 10
= 35 + \(\frac{2}{46-35}\) × 10
= 35 + \(\frac{20}{11}\) = 35 + 1.8 = 36.8.
For Mean:
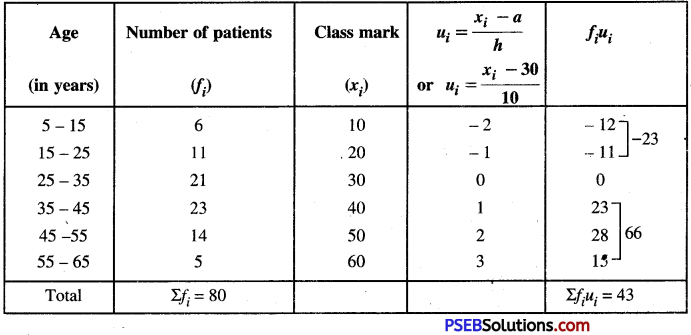
From above data,
Assumed mean (a) = 30
Width of class (h) = 10
∴ \(\bar{u}=\frac{\Sigma f_{i} u_{i}}{\Sigma f_{i}}=\frac{43}{80}\) = 0.5375
Using formula, Mean \((\overline{\mathrm{X}})=a+h \bar{u}\)
\(\bar{X}\) = 30 + 10 (0.5375)
= 30 + 5.375 = 35.375 = 35.37
Hence, mode of given data is 36.8 years and mean of the given data is 35.37 years. Also, it is clear from above discussion that average age of a patient admitted in the hospital is 35.37 years and maximum number of patients admitted in the hospital are of age 36.8 years.
![]()
Question 2.
The following data gives the information on the observed lifetimes (in hours) of 225 electrical components:
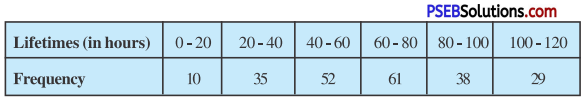
Determine the ¡nodal lifetimes of the components.
Solution:
In the given data.
Maximum frequency is 61 and it corresponds to the class interval 60 – 80.
∴ Model class = 60 – 80
So, l = 60; f1 = 61 ; f0 = 52; f2 = 38 and h = 20
Using formula, Mode = l + \(\left(\frac{f_{1}-f_{0}}{2 f_{1}-f_{0}-f_{2}}\right)\) × h
Mode = 60 + \(\left(\frac{61-52}{2(61)-52-38}\right)\) × 20
= 60 + \(\frac{9}{122-52-38}\) × 20
= 60 + \(\frac{9}{32}\) × 20
= 60 + \(\frac{180}{32}\)
= 60 + 5.625 = 65.625
Hence, modal Lifetimes of the components is 65.625 hours.
![]()
Question 3.
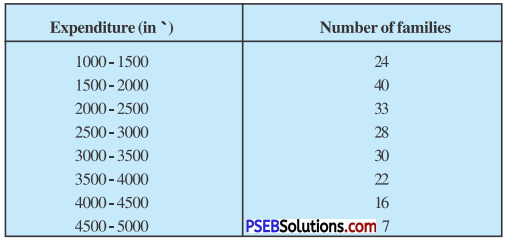
The following data gives the distribution of total monthly household expenditure of 200 families of a village. Find the modal monthly expenditure of the families. Also, find the mean monthly expenditure:
Solution:
For Mode: In the given data.
Maximum frequency is 40, and it corresponds to the class interval 1500 – 2000.
∴ Model class = 1500 – 2000
So, l = 1500; f1 = 40; f0 = 24; f2 = 33 and h = 500
Using formula, Mode = l + \(\left(\frac{f_{1}-f_{0}}{2 f_{1}-f_{0}-f_{2}}\right)\) × h
= 1500 + \(\left\{\frac{40-24}{2(40)-24-33}\right\}\) × 500
= 1500 + \(\left\{\frac{16}{80-24-33}\right\}\) × 500
= 1500 + \(\frac{16 \times 500}{23}\)
= 1500 + \(\frac{8000}{23}\) = 1500 + 347.83 = 1847.83
For Mean:
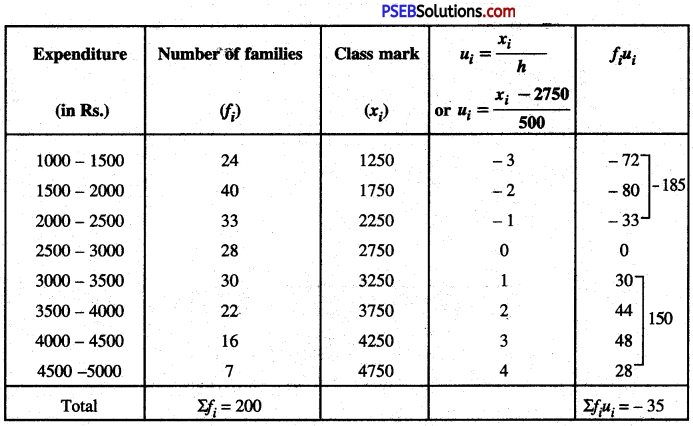
From above data,
Assumed Mean (a) = 2750
Length of width (h) = 500
\(\bar{u}=\frac{\Sigma f_{i} u_{i}}{\Sigma f_{i}}=-\frac{35}{200}\) = – 0.175
Using formula, Mean \((\overline{\mathrm{X}})=a+h \bar{u}\)
\(\overline{\mathbf{X}}\) = 2750 + 500 (- 0.175)
= 2750 – 87.50 = 2662.50
Hence, the modal monthly expenditure of family is 1847.83 and the mean monthly expenditure is 2662.50.
![]()
Question 4.
The following distribution gives the slate-wise teacher-student ratio in higher secondary schools of India. Find the mode and mean of this data. Interpret the two measures.
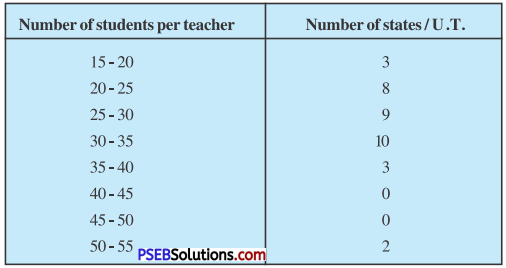
Solution:
For Mode:
In the given data,
Maximum frequency is 10 and it corresponds to the class interval is 30 – 35.
∴ Modal class = 30 – 35.
So, l = 30; f1 = 10; f0 = 9; f2 = 3 and h = 5
using formula, Mode = l + \(\left(\frac{f_{1}-f_{0}}{2 f_{1}-f_{0}-f_{2}}\right)\) × h
Mode = 30 + \(\left(\frac{10-9}{2(10)-9-3}\right)\) × 5
= 30 + \(\frac{1}{20-12}\) × 5
= 30 + \(\frac{5}{8}\) = 30 + 0.625 = 30.625 = 30.63 (approx.)
For mean:
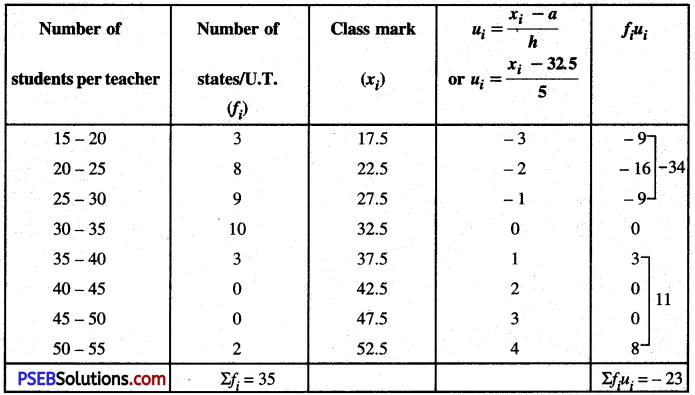
From above data, Assumed Mean (a) = 32.5
Width of class (h) = 5
∴ \(\bar{u}=\frac{\Sigma f_{i} u_{i}}{\Sigma f_{i}}=-\frac{23}{35}\) = – 0.65
Using formula, Mean \((\overline{\mathrm{X}})=a+h \bar{u}\)
\(\overline{\mathbf{X}}\) = 32.5 + 5 (- 0.65)
= 32..5 – 3.25 = 29.25 (approx.)
Hence, mode and mean of given data is 30.63 and 29.25. Also, from above discussion, it clear that states/U.T. have student per teacher is 30.63 and on average, this ratio is 29.25.
![]()
Question 5.
The given distribution shows the number of runs scored by some top batsmen of the world in one-day international cricket matches
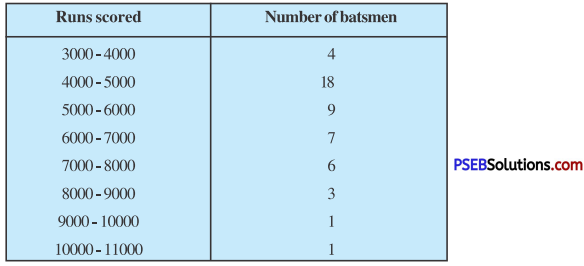
Find the mode of the data.
Solution:
In the given data,
Maximum frequency is 18 and it corresponds to the class interval 4000 – 5000.
∴ Modal class = 4000 – 5000
So, l = 4000; f1 = 18; f0 = 4; f2 = 9 and h = 1000
Using formula, Mode = l + \(\left(\frac{f_{1}-f_{0}}{2 f_{1}-f_{0}-f_{2}}\right)\) × h
Mode = 4000 + \(\left(\frac{18-4}{2(18)-4-9}\right)\) × 1000
= 4000 + \(\frac{14}{36-13}\) × 1000
= 4000 + \(\frac{14000}{23}\) = 4000 + 608.6956
= 4000 + 608.7 = 4608.7 (approx.)
Hence, mode of the given data is 4608.7.
![]()
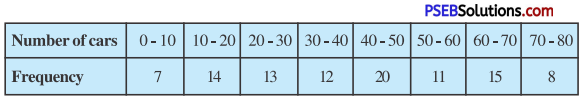
Question 6.
A student noted the number of cars passing through a spot on a road for 100 periods each of 3 minutes and summarised It in the table given below. Find the mode of the data:
Solution:
In the given data,
Maximum frequency is 20 and it corresponds to the class interval 40 – 50
∴ Modal Class = 40 – 50
So, l = 40; f1 = 20; f0 = 12; f2= 11 and h = 10
Using formula, Mode = l + \(\left(\frac{f_{1}-f_{0}}{2 f_{1}-f_{0}-f_{2}}\right)\) × h
Mode = 40 + \(\left(\frac{20-12}{2(20)-12-11}\right)\) × 10
= 40 + \(\frac{8}{40-23}\) × 10
= 40 + \(\frac{80}{17}\) = 40 + 4.70588
= 40 + 4.7 = 44.7 (approx.)
Hence, mode of the given data is 44.7 cars.